Observability and metrics
The three pillars of observability:
- Logging
- Monitoring
- Distributed Tracing
This Istio demo supports observabilty using Prometheus and Grafana for monitoring, and Jaeger and Kiali for tracing.
Load generation
Before looking at metrics, it is helpful to generate a load on the application. In this instance, we will generate a load for 5 minutes using
the istio/fortio image, but other load generators are available and some are documented at the end of this
article.
Connect to one of your Docker nodes and run the fortio image:
# ssh hpe-worker01

# docker run istio/fortio load -t 5m -qps 5 http://hpe2-ucp01.am2.cloudra.local:33380/productpage
Alternatively, you could run the load from the Ansible controller using kubectl:
# kubectl run fortio --image=istio/fortio -- load -t 5m -qps 5 http://hpe2-ucp01.am2.cloudra.local:33380/productpage

deployment.apps/fortio created
Note: The docker version of the command will stop as expected after 5 minutes.
However, the kubectl version will run forever, by default, as the pod will get restarted
automatically. While you can set --restart='Never', it may be preferrable to set --restart='OnFailure'
as issues have been seen with the pod failing to access the URL immediately after it has started. Ideally,
you would create a CronJob resource for such a run-once operation.
Querying Metrics from Prometheus
The following query shows the requests to the various services (productpage, details, ratings, reviews) building
up over the 5 minute duration of the load test. (Prometheus is available on port 33090 on any node in the cluster, based on the original configuration).
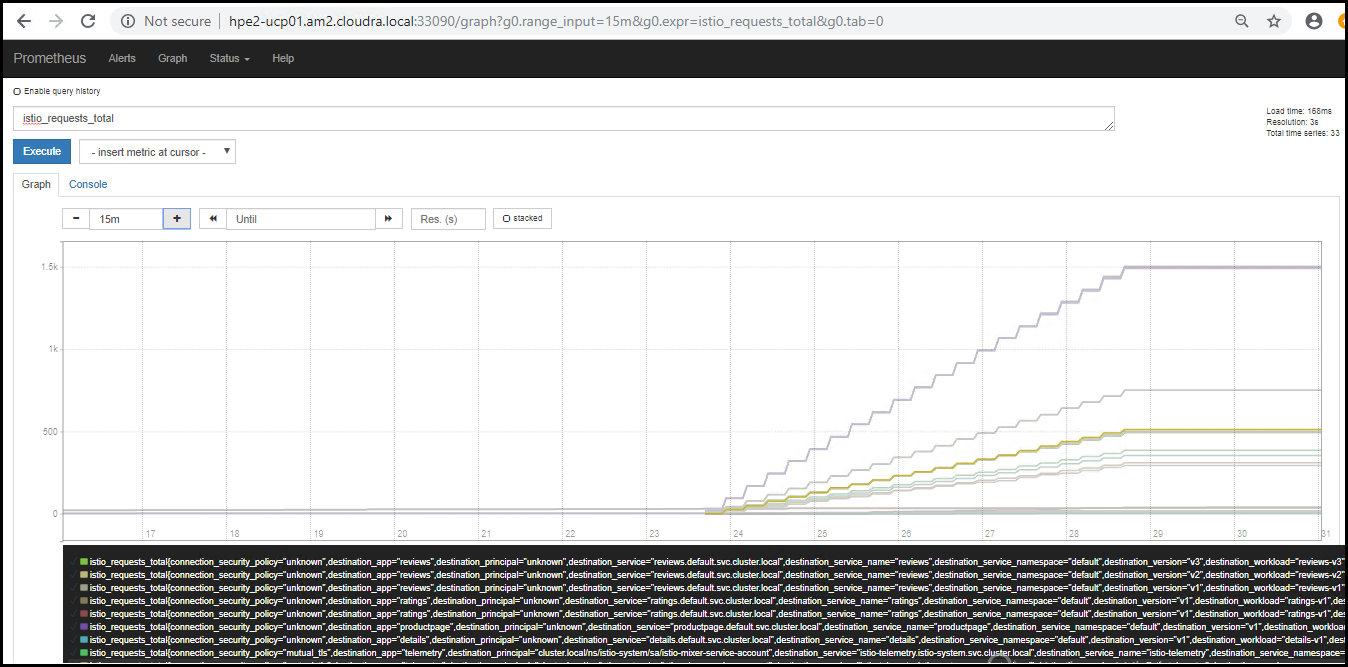
Figure. Prometheus load
Vizualizing Metrics with Grafana
The demo deploys a number of Grafana dashboards for visualizing various aspects of application. (Grafana is available on port 33080 on any node in the cluster, based on the original configuration).
Mesh dashboard
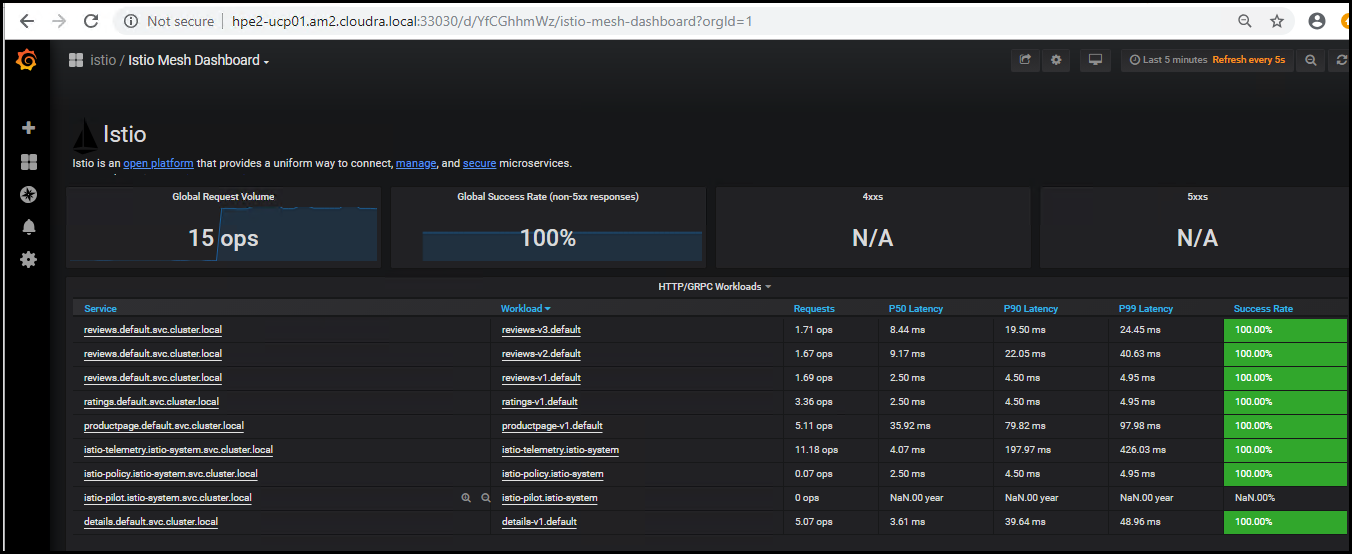
Figure. Istio Mesh Dashboard
This gives the global view of the Mesh along with services and workloads in the mesh. You can get more details about services and workloads by navigating to their specific dashboards as explained below.
Service dashboard
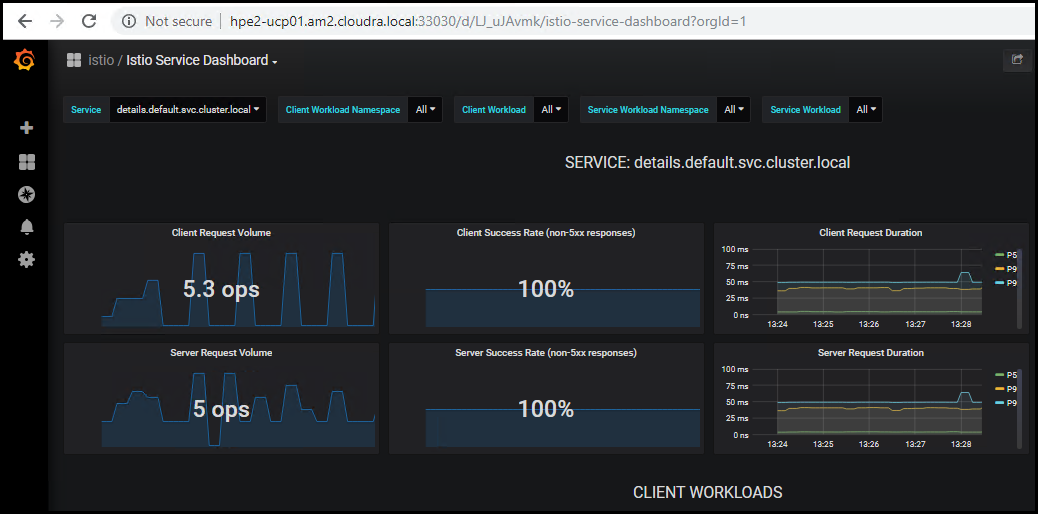
Figure. Istio Service Dashboard
This gives details about metrics for the service and then client workloads (workloads that are calling this service) and service workloads (workloads that are providing this service) for that service.
Workload dashboard
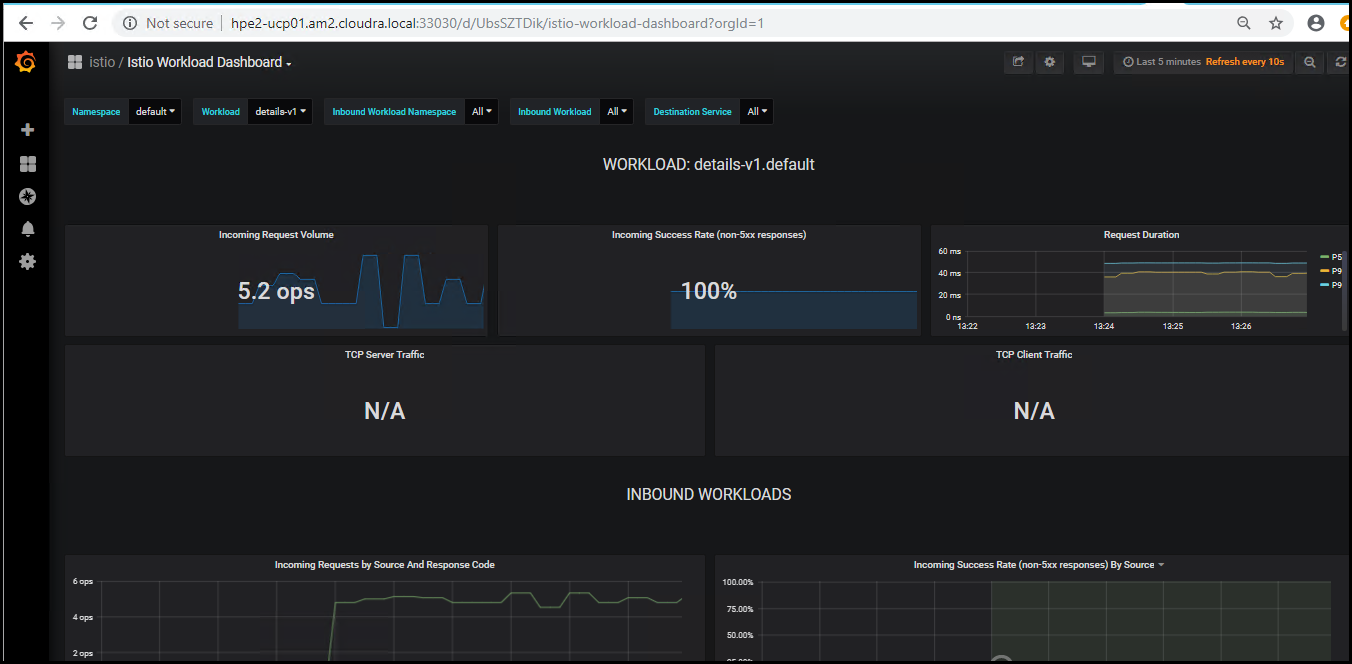
Figure. Istio Workload Dashboard
This gives details about metrics for each workload and then inbound workloads (workloads that are sending request to this workload) and outbound services (services to which this workload send requests) for that workload.
Performance dashboard
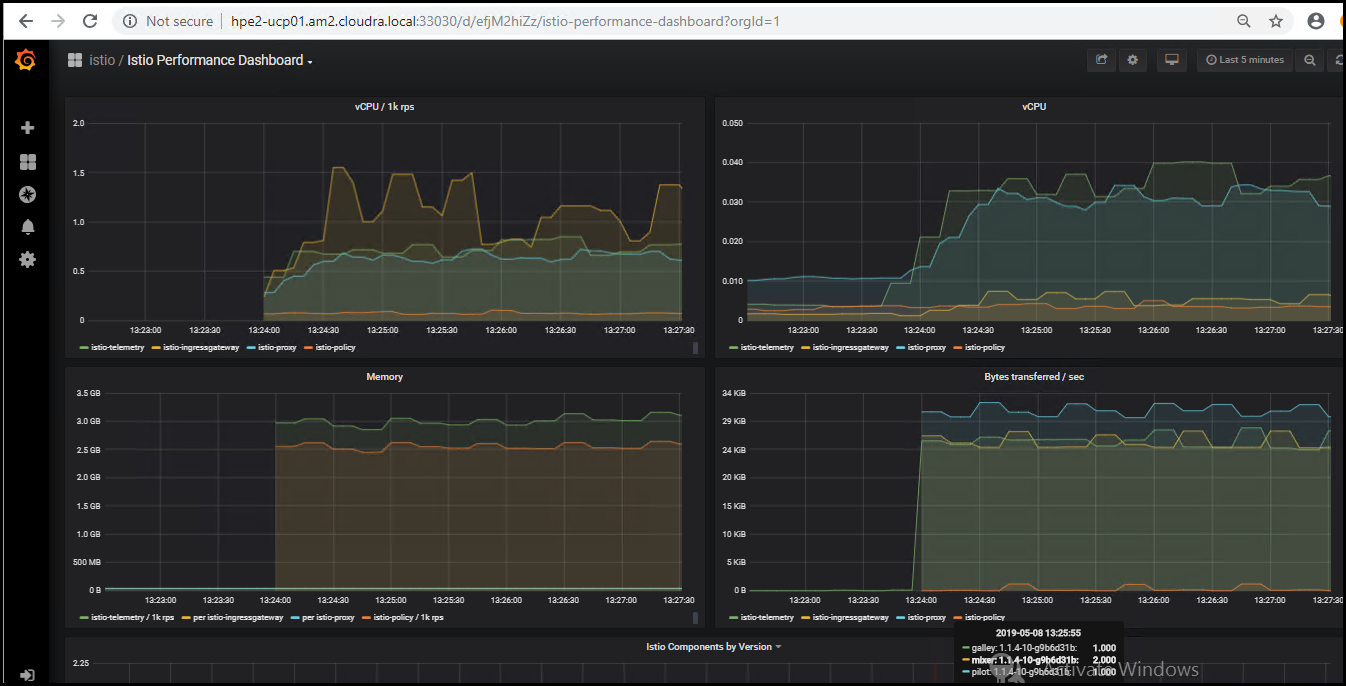
Figure. Istio Performance Dashboard
Mixer dashboard

Figure. Istio Mixer Dashboard
Galley dashboard
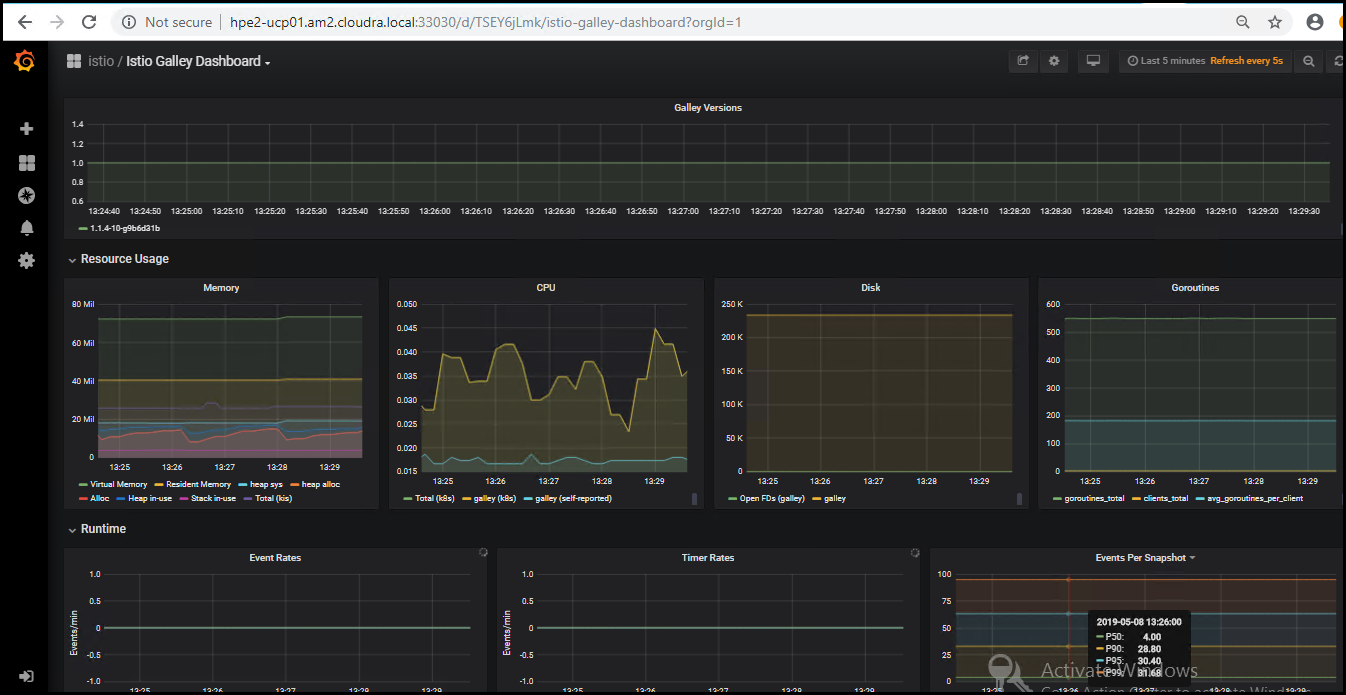
Figure. Istio Galley Dashboard
Pilot dashboard
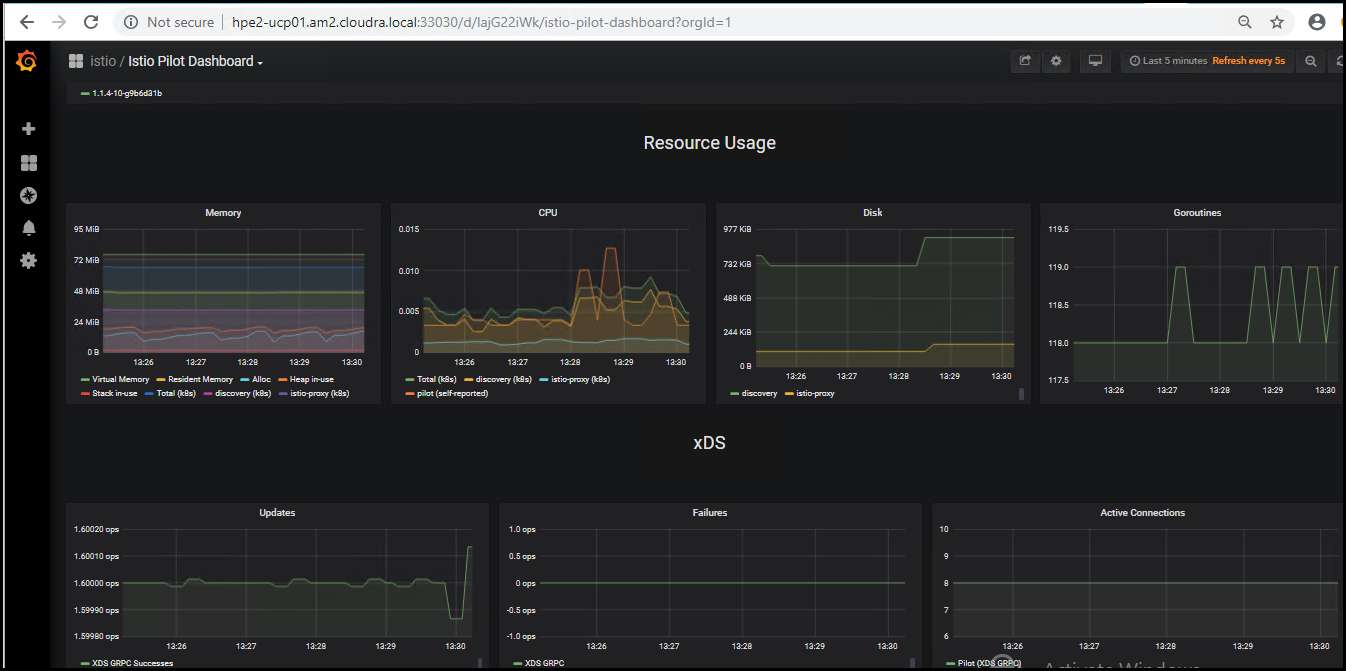
Figure. Istio Pilot Dashboard
Using Jaeger for distributed tracing
Jaeger is a distributed tracing system released as open source by Uber Technologies. It is used for monitoring and troubleshooting microservices-based distributed systems, including:
- Distributed context propagation
- Distributed transaction monitoring
- Root cause analysis
- Service dependency analysis
- Performance / latency optimization
Jaeger is available on port 33086 on any node in the cluster, based on the original configuration:
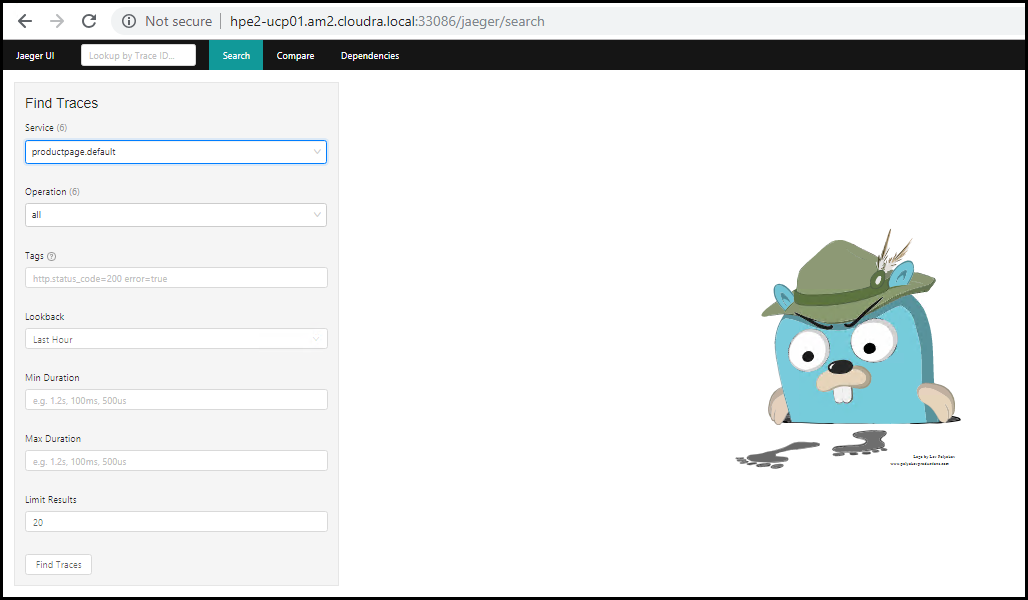
Figure. Jaeger search
Select the productpage service and click Find Traces (if necessary, set the Loookback field to cover the time period when you ran the load). An overview of the available traces is displayed:
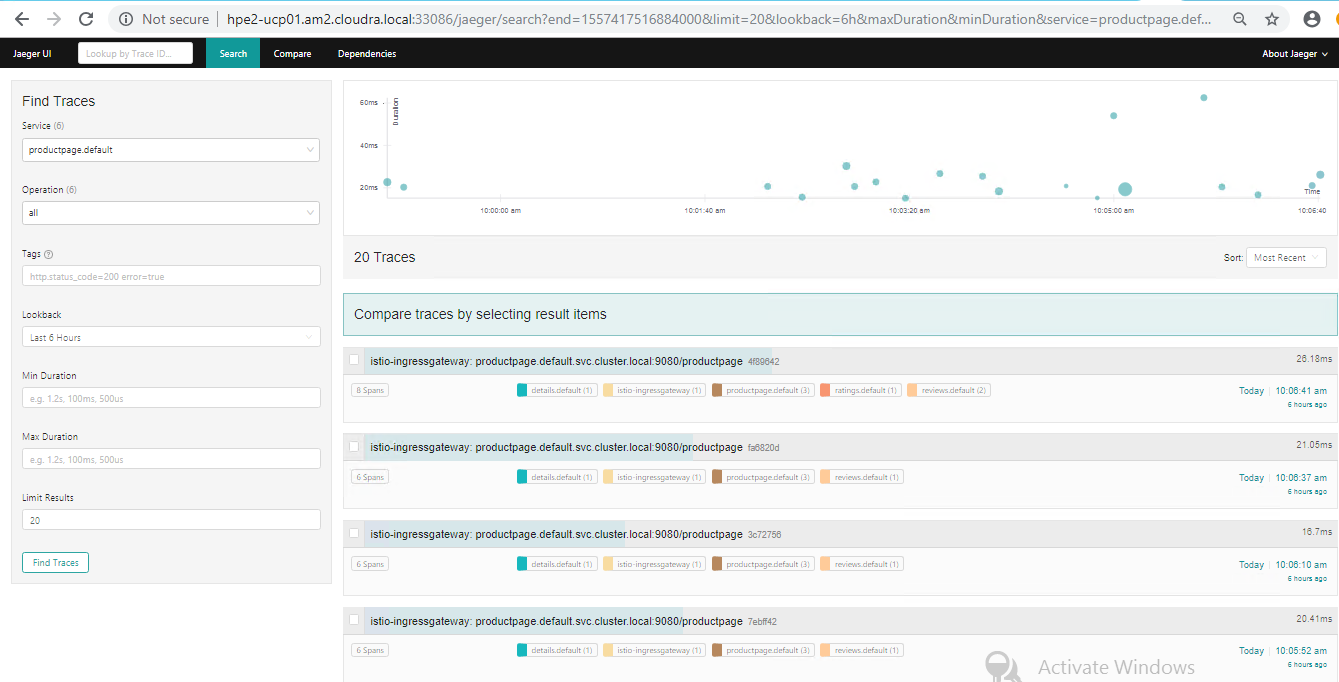
Figure. Jaeger traces
Click on a trace in the list to drill down into the timing details - you can see how the response time for
productpage is divided up between the individual details, ratings and reviews services:

Figure. Jaeger drill down
Using Kiali to vizualize the service mesh topology
Kiali works with Istio to visualize the service mesh topology, including features like circuit breakers or request rates. Kiali also includes Jaeger Tracing to provide distributed tracing out of the box. (Kiali is available
on port 330001 on any node in the cluster, based on the original configuration. The default login is admin \ admin).
The following image is a graph representation of the Bookinfo application, showing the three separate reviews services (no stars, black stars, red stars) used when a call is made for the product page.
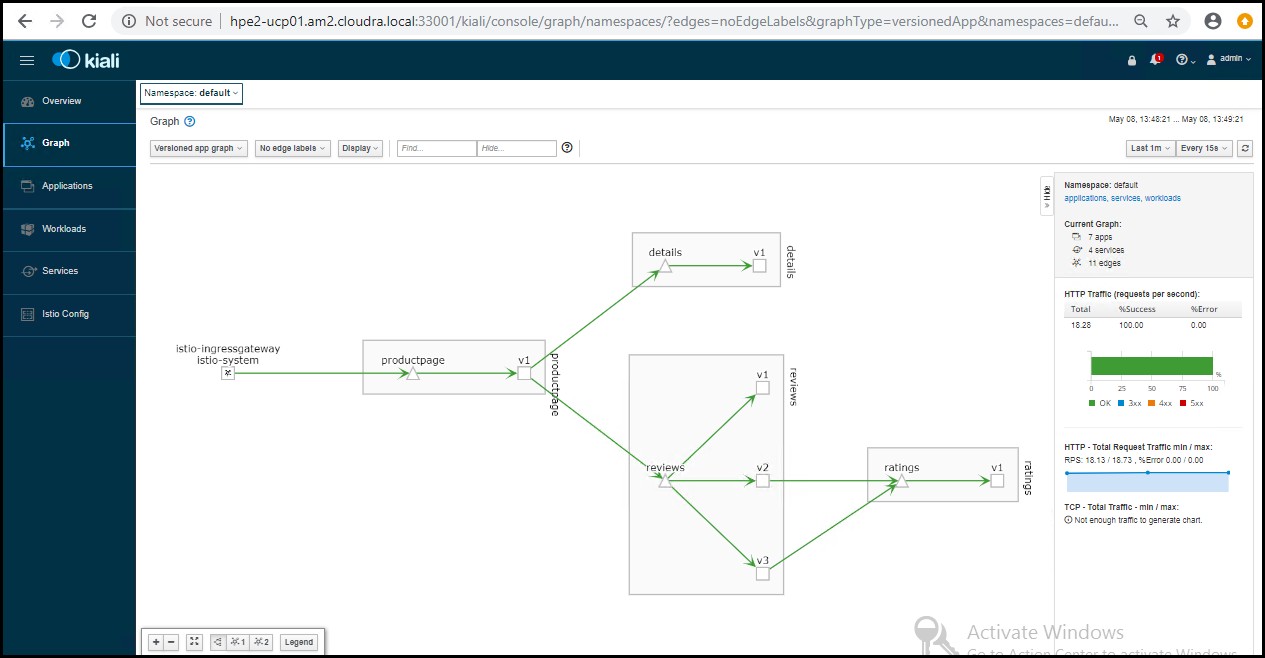
Figure. Kiali graph
You can click on any edge in the graph to see how much traffic has traversed that particular route. In this case, an equal amount of traffic will have gone to each of the three versions of the reviews service.
Resources
# kubectl run siege --image=yokogawa/siege -- -d1 -r10 -c25 www.google.com
kubectl run stress --image=progrium/stress --cpu 2 --io 1 --vm 2 --vm-bytes 128M --timeout 1000s