Traffic management
Migrating traffic from one version of a service to another
Route all traffic to the v1 version of the services by applying the file virtual-service-all-v1.yaml:
# kubectl apply -f samples/bookinfo/networking/virtual-service-all-v1.yaml
In particular, the reviews service is limited to using only v1:
apiVersion: networking.istio.io/v1alpha3
kind: VirtualService
metadata:
  name: reviews
spec:
  hosts:
  - reviews
  http:
  - route:
    - destination:
        host: reviews
        subset: v1
If you refresh the product page in your browser, you will now only ever see the reviews without any (black or red) star ratings.
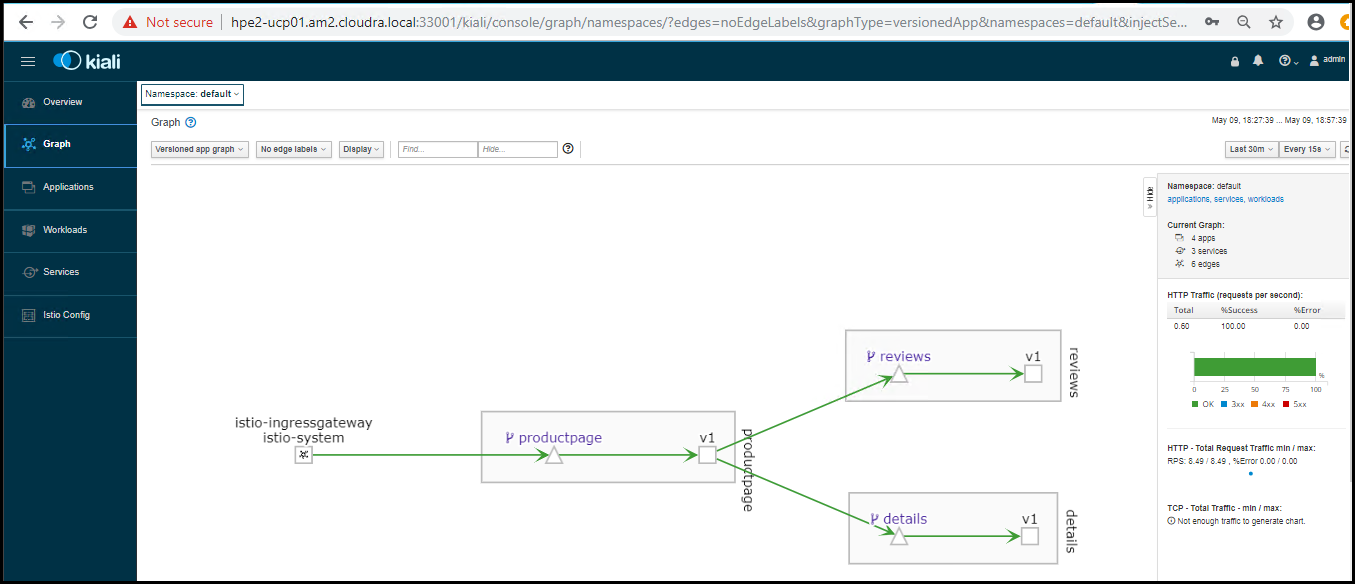
If you re-run the load generating tool to access the application and then view the graph in Kaili,
you will see that only v1 of the reviews service is used:

Figure. Kiali graph for v1 only
Now share the traffic 50/50 between v1 and v3 of the ratings service by applying the file
virtual-service-reviews-50-v3.yaml:
# kubectl apply -f samples/bookinfo/networking/virtual-service-reviews-50-v3.yaml
The yaml file splits the reviews 50/50 between v1 and v3:
apiVersion: networking.istio.io/v1alpha3
kind: VirtualService
metadata:
  name: reviews
spec:
  hosts:
    - reviews
  http:
  - route:
    - destination:
        host: reviews
        subset: v1
      weight: 50
    - destination:
        host: reviews
        subset: v3
      weight: 50
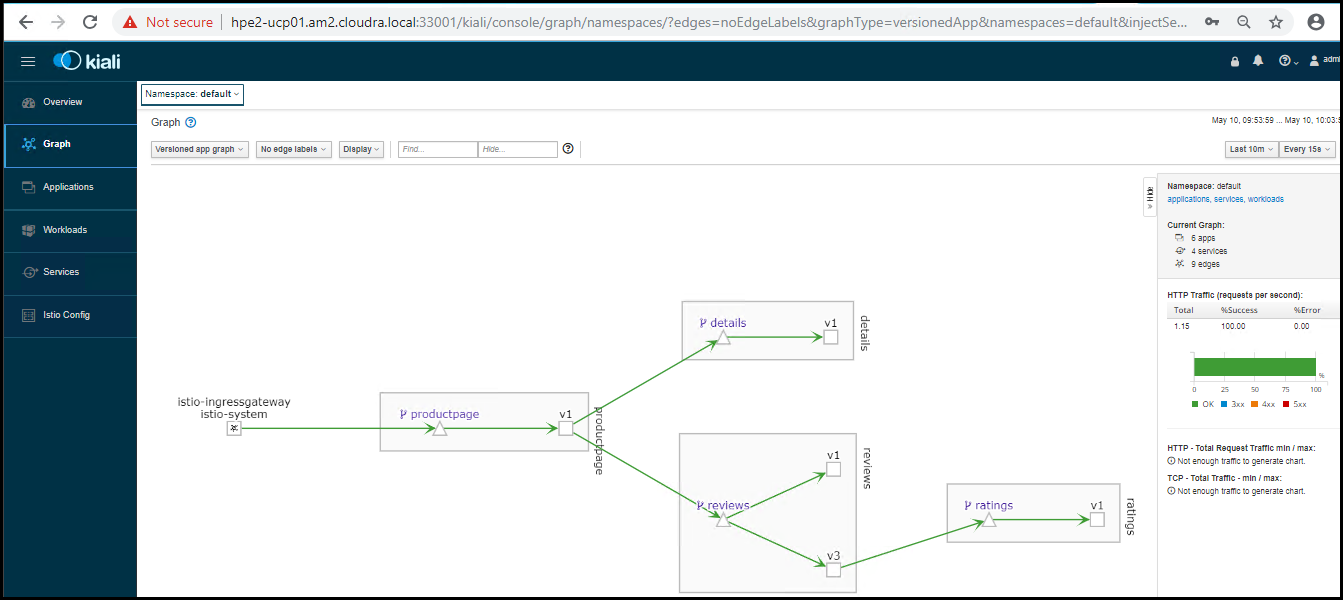
Wait a few seconds for the new rules to propagate. Now, refresh /productpage in your browser and you should see
red colored star ratings approximately 50% of the time. Run the load generation tool again to generate sufficient
data for Kiali to graph the distribution of traffic between the two versions of the service.

Figure. Kiali graph with 50/50 split between v1 and v3
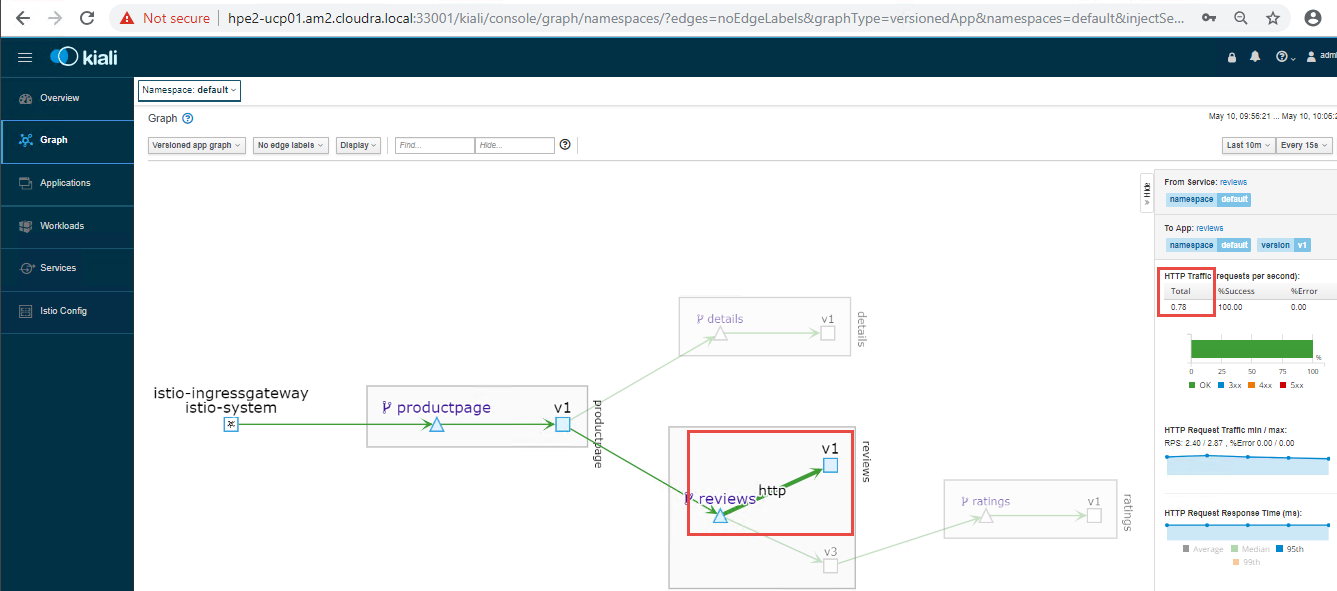
You can see the actual amount of traffic for each version of the service by clicking on the appropriate
edge on the graph. First, click on the v1 edge:

Figure. Kiali graph showing details of v1 traffic
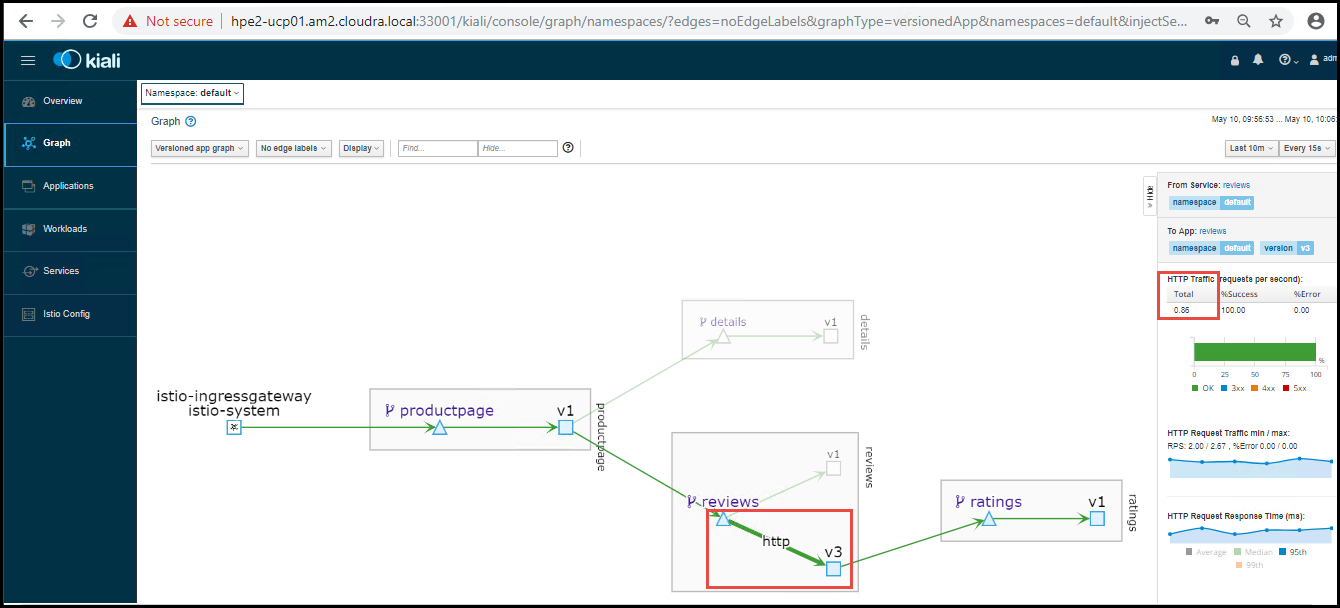
Now click on the v3 edge:

Figure. Kiali graph showing details of v3 traffic
The number of requests to the v1 service should be roughly equal to that for the v3 service.