UCP metrics in Prometheus
Introduction
Docker EE 2.1 uses a built-in deployment of Prometheus to power the performance graphs in the web UI for UCP. The metrics that UCP generates can be routed to a separate Prometheus, if required. A convenience playbook has been provided to configure a minimal Prometheus and Grafana deployment that can help vizualize all of the metrics that UCP generates.
For more information on UCP cluster metrics, see the article at https://docs.docker.com/ee/ucp/admin/configure/collect-cluster-metrics/.
Prerequisites
- Install the
kubectlbinary on your Ansible box - Install the UCP Client bundle for the
adminuser - Confirm that you can connect to the cluster by running a test command, for example,
kubectl get nodes
Deploy Prometheus and Grafana
The playbook playbooks/ucp-metrics-prometheus.yml deploys pods for Prometheus and Grafana and configures them
to use the client bundle to access the UCP metrics. To run the playbook:
# cd ~/Docker-SimpliVity
# ansible-playbook -i vm_hosts playbooks/ucp-metrics-prometheus.yml --vault-password-file .vault_pass
Prometheus UI
The playbook exposes a port to access the user interface for Prometheus - to find the port, get the details of the prometheus service:
# kubectl get svc prometheus

NAME         TYPE       CLUSTER-IP      EXTERNAL-IP   PORT(S)          AGE
prometheus   NodePort   10.96.216.220   <none>        9090:34713/TCP   6d
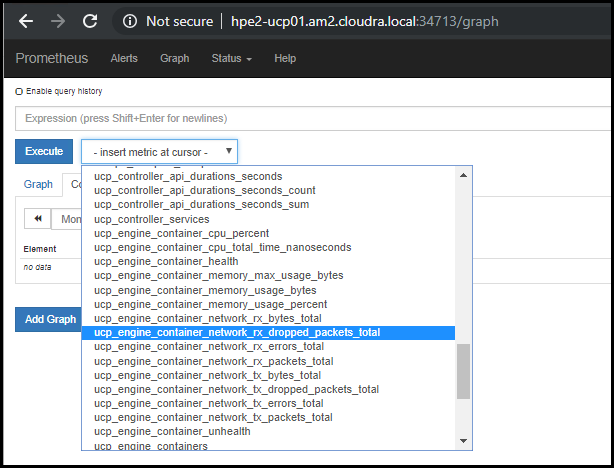
The Prometheus UI can be accessed on any node in your cluster, using the port returned by kubectl get svc. In this instance, it is accessed at http://hpe2-ucp01.am2.cloudra.local:34713.

Figure. UCP metrics in Prometheus
Using Grafana to vizualize UCP metrics
The playbook also exposes a port to access the Grafana UI - to find the port, get the details of the grafana service:
# kubectl get svc grafana

NAME      TYPE       CLUSTER-IP      EXTERNAL-IP   PORT(S)          AGE
grafana   NodePort   10.96.177.108   <none>        3000:33118/TCP   6d
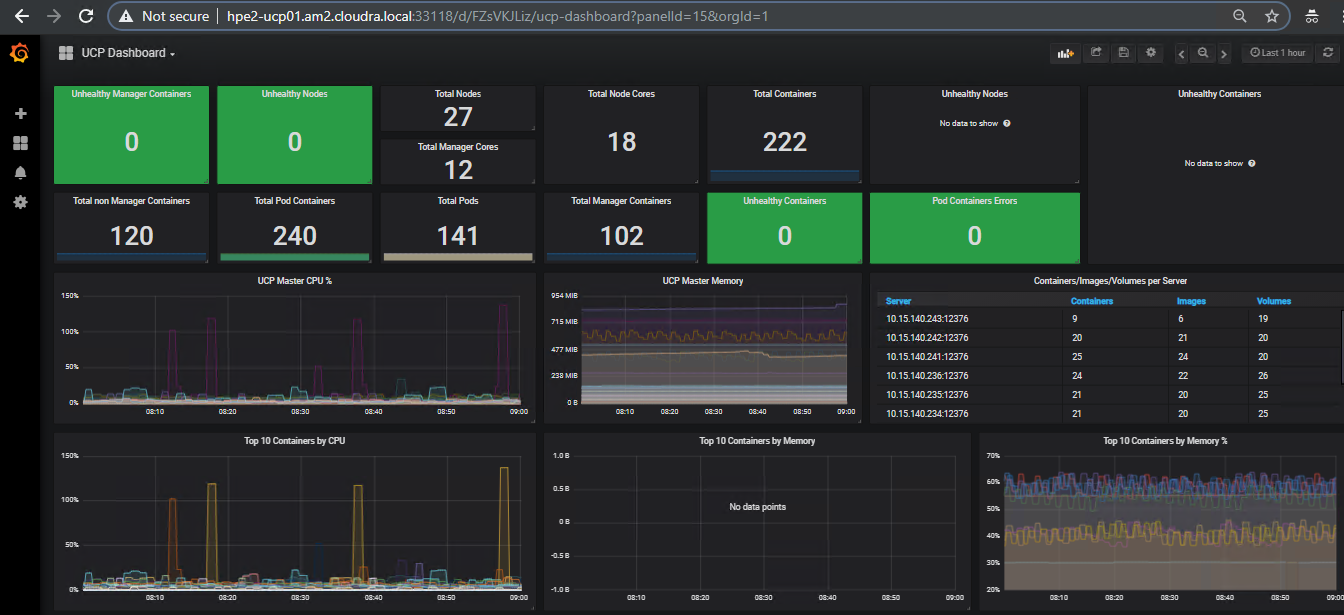
The Grafana UI can be accessed on any node in your cluster, using the port returned by kubectl get svc. In this
instance, it is accessed at http://hpe2-ucp01.am2.cloudra.local:33118. The example UCP Dashboard is taken from
https://grafana.com/dashboards/9309.

Figure. UCP Dashboard in Grafana