Grafana UI
The Grafana UI is available via your UCP, DTR or Kubernetes worker nodes, using HTTP on port 33030,
for example,
http://hpe-ucp01.am2.cloudra.local:33030
The default username and password for Grafana is admin/admin. The first time you login, you will be asked
to reset the default admin password.
A number of dashboards are installed by default. The following figues illustrate some of the dashboard provided.
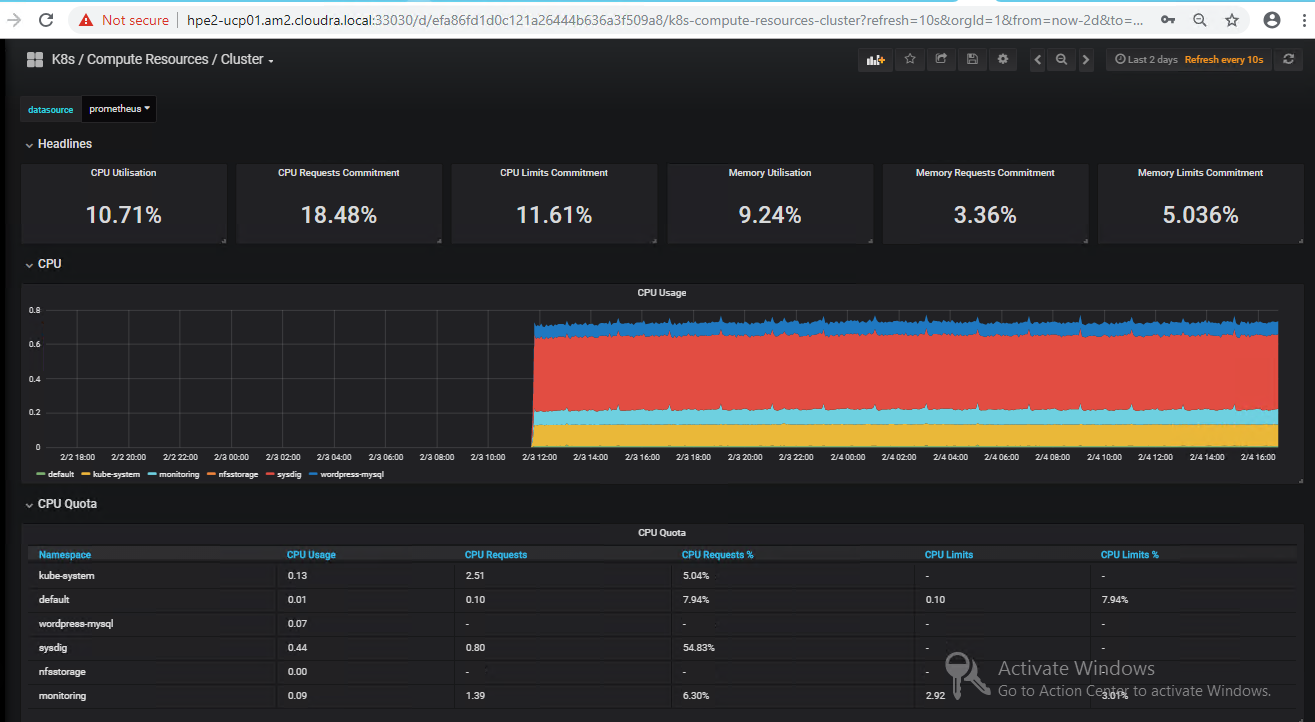
Figure: Compute resources dashboard
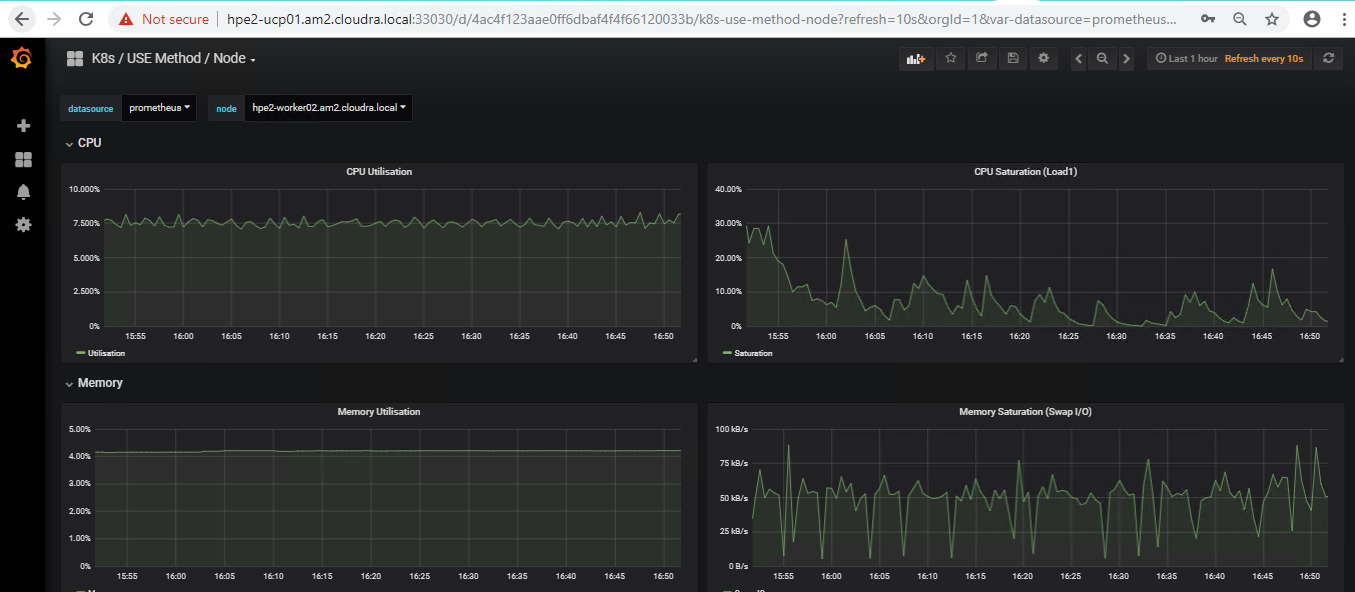
Figure: USE method node dashboard
Figure: USE method nodes dashboard
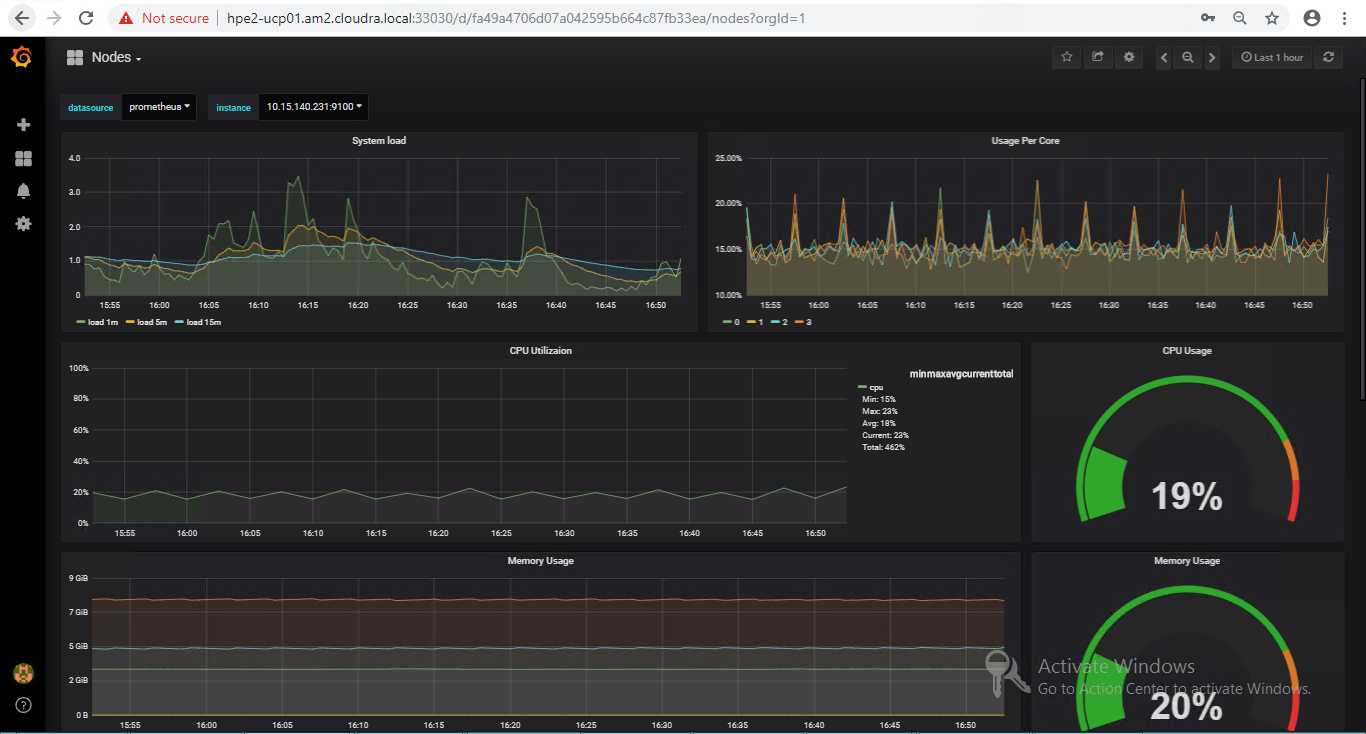
Figure: Nodes dashboard
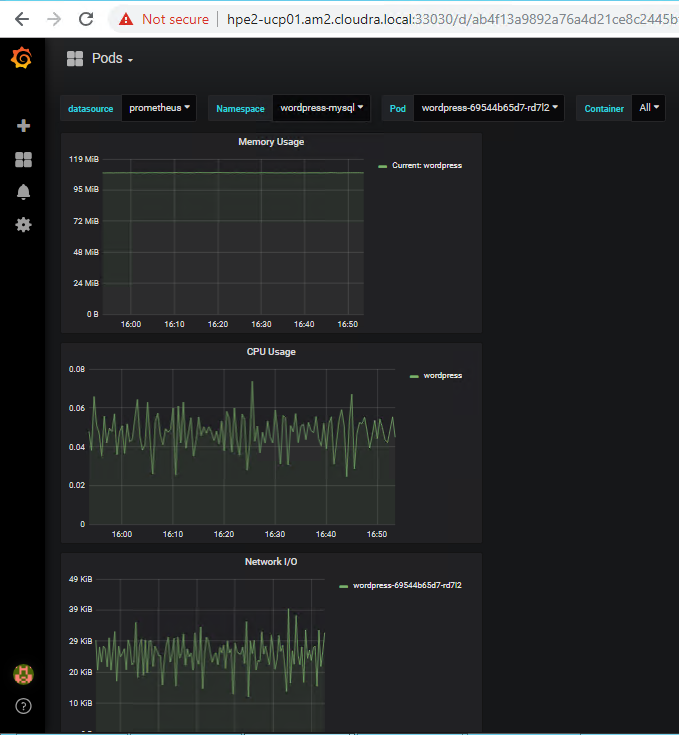
Figure: Pods dashboard