Monitoring Kubernetes with Prometheus and Grafana
Monitoring a Kubernetes cluster with Prometheus is a natural choice as Kubernetes components themselves are instrumented with Prometheus metrics, therefore those components simply have to be discovered by Prometheus and most of the cluster is monitored.
The solution uses the Prometheus Operator to deploy Prometheus and Grafana. The playbooks install kube-state-metrics and node-exporter components, as well as supporting kubelet and apiserver metrics. Sample dashboards for Grafana are installed to help you monitor your Kubernetes infrastructure.
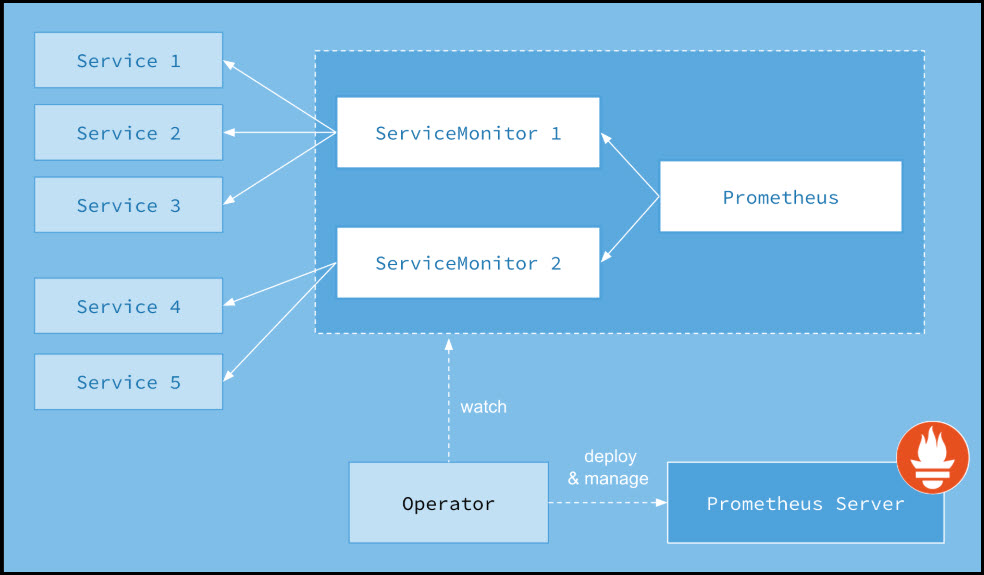
The Prometheus Operator makes running Prometheus on top of Kubernetes as easy as possible, while preserving Kubernetes-native configuration options. It introduces additional resources in Kubernetes to declare the desired state and configuration of Prometheus. The Prometheus resource declaratively describes the desired state of a Prometheus deployment, while a ServiceMonitor describes the set of targets to be monitored by Prometheus.

Figure: Prometheus Operator