Prometheus UI
The Prometheus UI is available via your UCP, DTR or Kubernetes worker nodes, using HTTP on port 33090, for example,
http://hpe-ucp01.am2.cloudra.local:33090
To see what services are being monitored, access the service discovery page, via Status -> Service Discovery, or using the /service-discovery endpoint:
http://hpe2-ucp01.am2.cloudra.local:33090/service-discovery
The monitored services are listed as shown in the following figure.

Figure: Prometheus service discovery
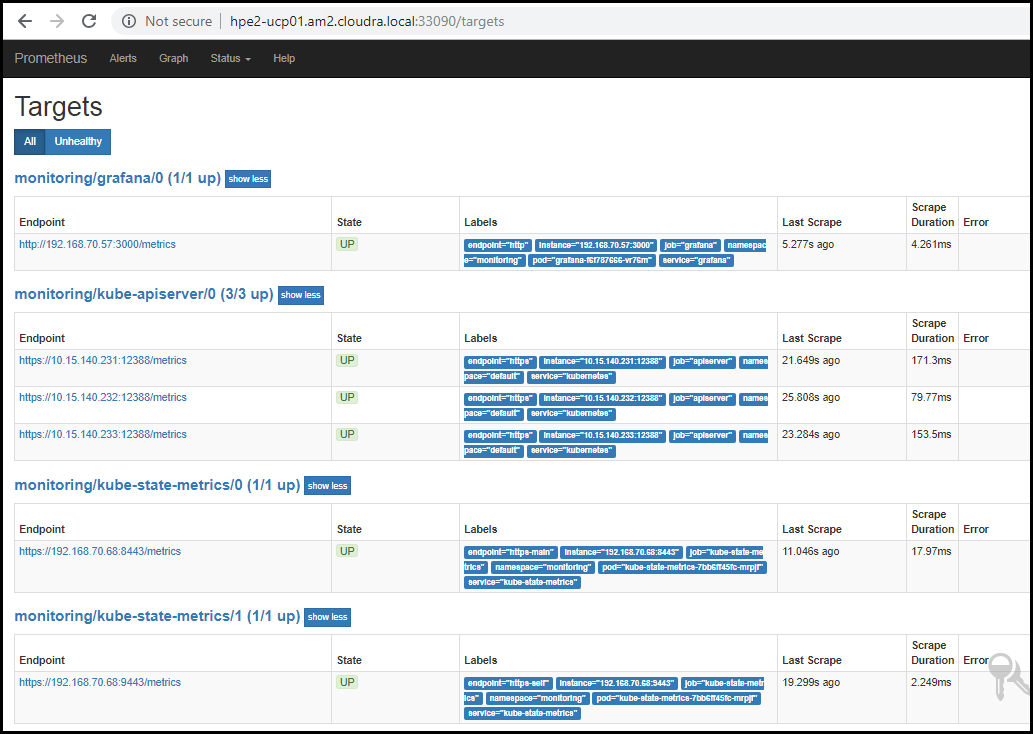
To see the status for the monitored services, access the targets page via Status -> Targets or using the endpoint /targets.
http://hpe2-ucp01.am2.cloudra.local:33090/targets
The status of the various monitors are displayed, as shown in the following figure.

Figure: Prometheus targets
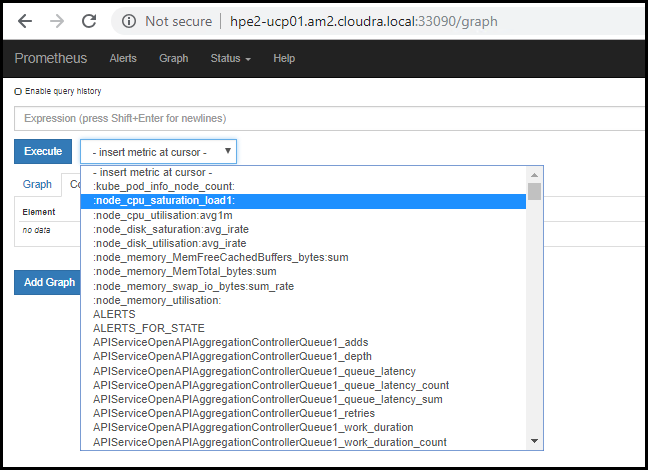
To see all the metrics available, click on Graph or use the endpoint /graph:
http://hpe2-ucp01.am2.cloudra.local:33090/graph
Click on the drop-down titled - insert metric at cursor - to see all the metrics that are available to Prometheus.

Figure: Prometheus metrics
Node Exporter
Metrics specific to the Node Exporter are prefixed with node_ and include metrics like node_cpu_seconds_total and node_exporter_build_info. The table below lists some example expressions.
| Metric | Meaning |
|---|---|
| rate(node_cpu_seconds_total{mode="system"}[1m]) | The average amount of CPU time spent in system mode, per second, over the last minute (in seconds) |
| node_filesystem_avail_bytes | The filesystem space available to non-root users (in bytes) |
| rate(node_network_receive_bytes_total[1m]) | The average network traffic received, per second, over the last minute (in bytes) |
More information on the use of node-exporter metrics is available at https://github.com/prometheus/node_exporter.
cAdvisor
cAdvisor is an open source container resource usage and performance analysis agent. It is purpose-built for containers and supports Docker containers natively. In Kubernetes, cAdvisor is integrated into the Kubelet binary. cAdvisor auto-discovers all containers in the machine and collects CPU, memory, filesystem, and network usage statistics. cAdvisor also provides the overall machine usage by analyzing the ‘root’ container on the machine.
Kubelet exposes a simple cAdvisor UI for containers on a machine, via the default port 4194. However, this feature has been marked deprecated in v1.10 and completely removed in v1.12. For more inforation on how upcoming releases will reduce the set of metrics exposed by the kubelet, see the relevant issue page at https://github.com/kubernetes/kubernetes/issues/68522.
The Kubelet also starts an internal HTTP server on port 10255 and exposes endpoints including /metrics and /metrics/cadvisor. As this release of Express Containers uses Kubernetes 1.11, it is able to use this feature.
In future releases, it will be necessary to deploy cAdvisor as a DaemonSet for access to the cAdvisor UI.
The table below lists some example expressions using cAdvisor metrics.
| Expression | Description | For |
|---|---|---|
| rate(container_cpu_usage_seconds_total{name="redis"}[1m]) | The cgroup's CPU usage in the last minute (split up by core) | The redis container |
| container_memory_usage_bytes{name="redis"} | The cgroup's total memory usage (in bytes) | The redis container |
| rate(container_network_transmit_bytes_total[1m]) | Bytes transmitted over the network by the container per second in the last minute | All containers |
| rate(container_network_receive_bytes_total[1m]) | Bytes received over the network by the container per second in the last minute | All containers |
A full listing of cAdvisor-gathered container metrics exposed to Prometheus can be found in the cAdvisor documentation at https://github.com/google/cadvisor/blob/master/docs/storage/prometheus.md.