Monitoring with Splunk
Splunk Enterprise allows you to collect and index any data from any source, and to monitor systems and infrastructure in real time to preempt issues before they happen. It allows you to analyze your data to understand trends, patterns of activity and behavior, giving you valuable intelligence across your entire organization.

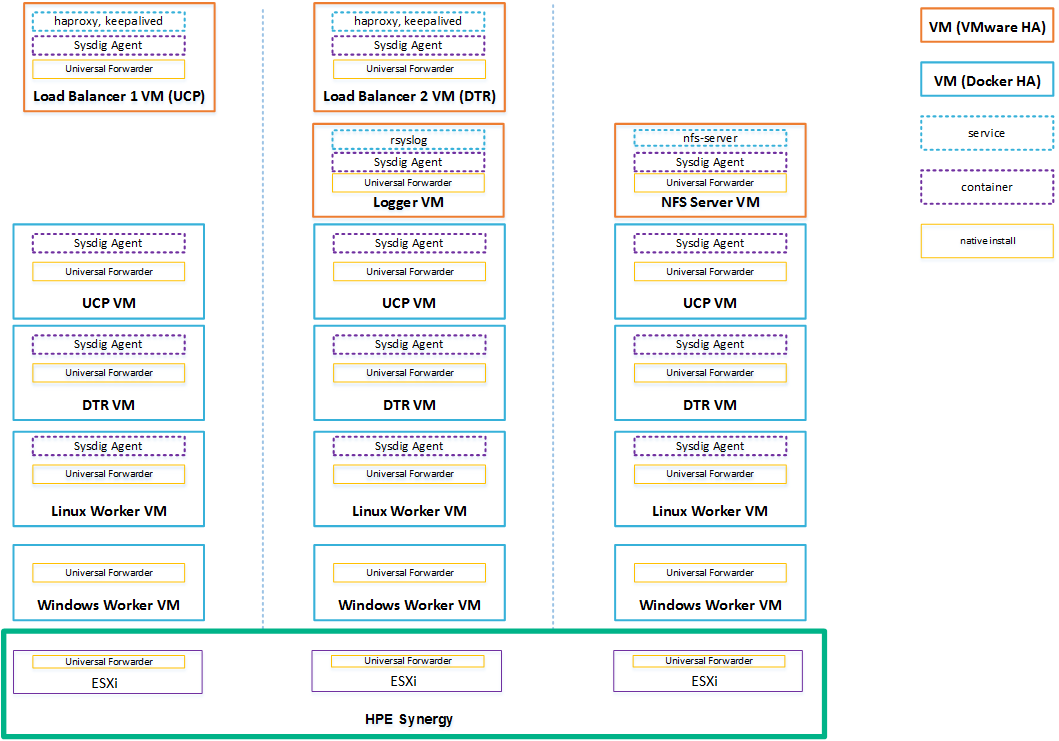
Figure. Solution architecture: Hybrid Linux and Windows VM workers with Splunk and Sysdig
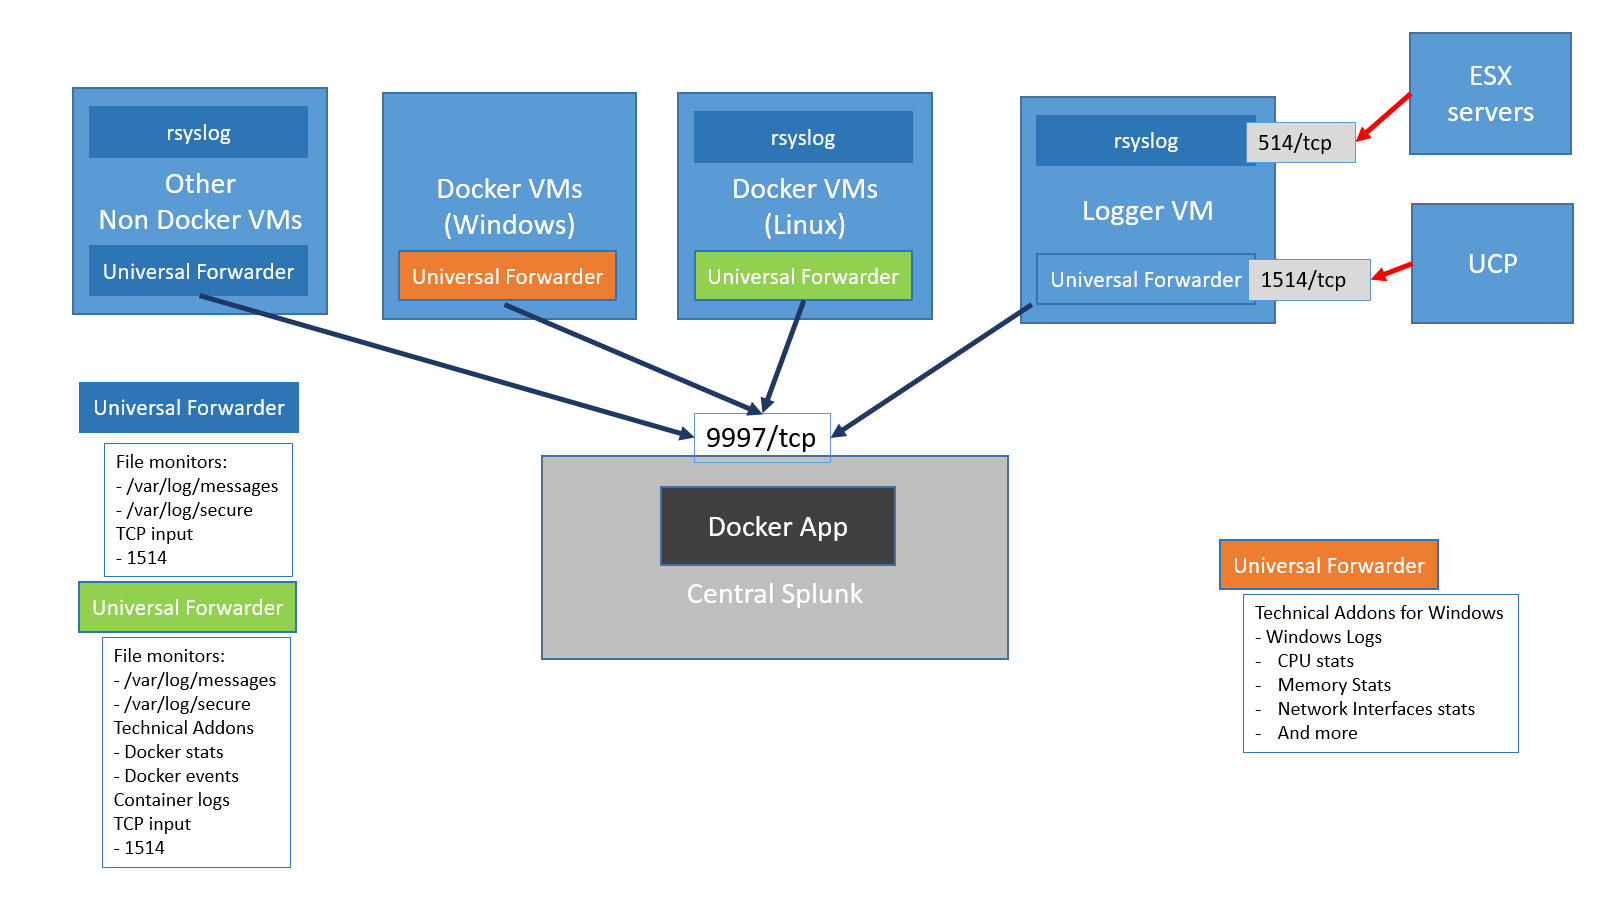
This solution allows you to integrate your Containers-as-a-Service (CaaS) deployment with an existing Splunk Enterprise installation or to deploy a stand-alone Splunk Enterprise demo environment as a Docker stack in your cluster. In both instances, Universal Forwarders are used to collect data from your applications running on your Linux and Windows worker nodes in your cluster, as well as log data from the Docker platform itself and from the infrastructure VMs and servers. The following diagram shows the Splunk architecture.

Figure 12. Splunk architecture
All the Universal Forwarders run natively on the operating system to allow greater flexibility in terms of configuration options. Each forwarder sends the data it collects to one or more indexers in the central Splunk.
Linux worker nodes: The Universal Forwarders on the Linux worker nodes collect log and metrics data. The log data includes:
/var/log/messagesfrom the Docker host (including the daemon engine logs)/var/log/securefrom the Docker hosts- container logs via a Splunk technical add-on
The metrics data is collected via a technical add-on and includes:
docker statsdocker topdocker eventsdocker service stats
Windows worker nodes: The Universal Forwarders running on the Windows worker nodes collect the following data:
- Windows logs
- CPU stats
- Memory stats
- Network Interface stats
- and more
For more information on configuring standalone Splunk for Linux and Windows worker nodes, see the section on Splunk prerequisites.
UCP and ESXi: UCP operational logs and ESXi logs are forwarded to the logger VM via TCP ports 1514 and 514 respectively. Port 1514 is assigned a special sourcetype of ucp which is then used by the Splunk Docker APP to interpret UCP logs. The Universal Forwarder runs the rsyslog daemon which will record the log messages coming from the ESX machines into the /var/log/messages file on the VM.
Non-Docker VMs: Other VMs, for example, NFS, use a Splunk monitor to collect and forward data from the following files:
- /var/log/messages
- /var/log/secure (Red Hat)
Note: You can configure the list of files monitored by the Universal Forwarder.
Other syslog senders can be configured to send their data to the logger VM or directly to central Splunk.