Monitor Results with SustainDC Dashboard
To get an in-depth look at the SustainDC dashboard and see real-time metrics, watch the video demonstration. The video showcases the dynamic plotting of variables from the agents, environments, and metrics, providing a comprehensive view of the DC operations.
Click on the screenshot below to watch the video (right-click and select “Open link in new tab” to view in a new tab):
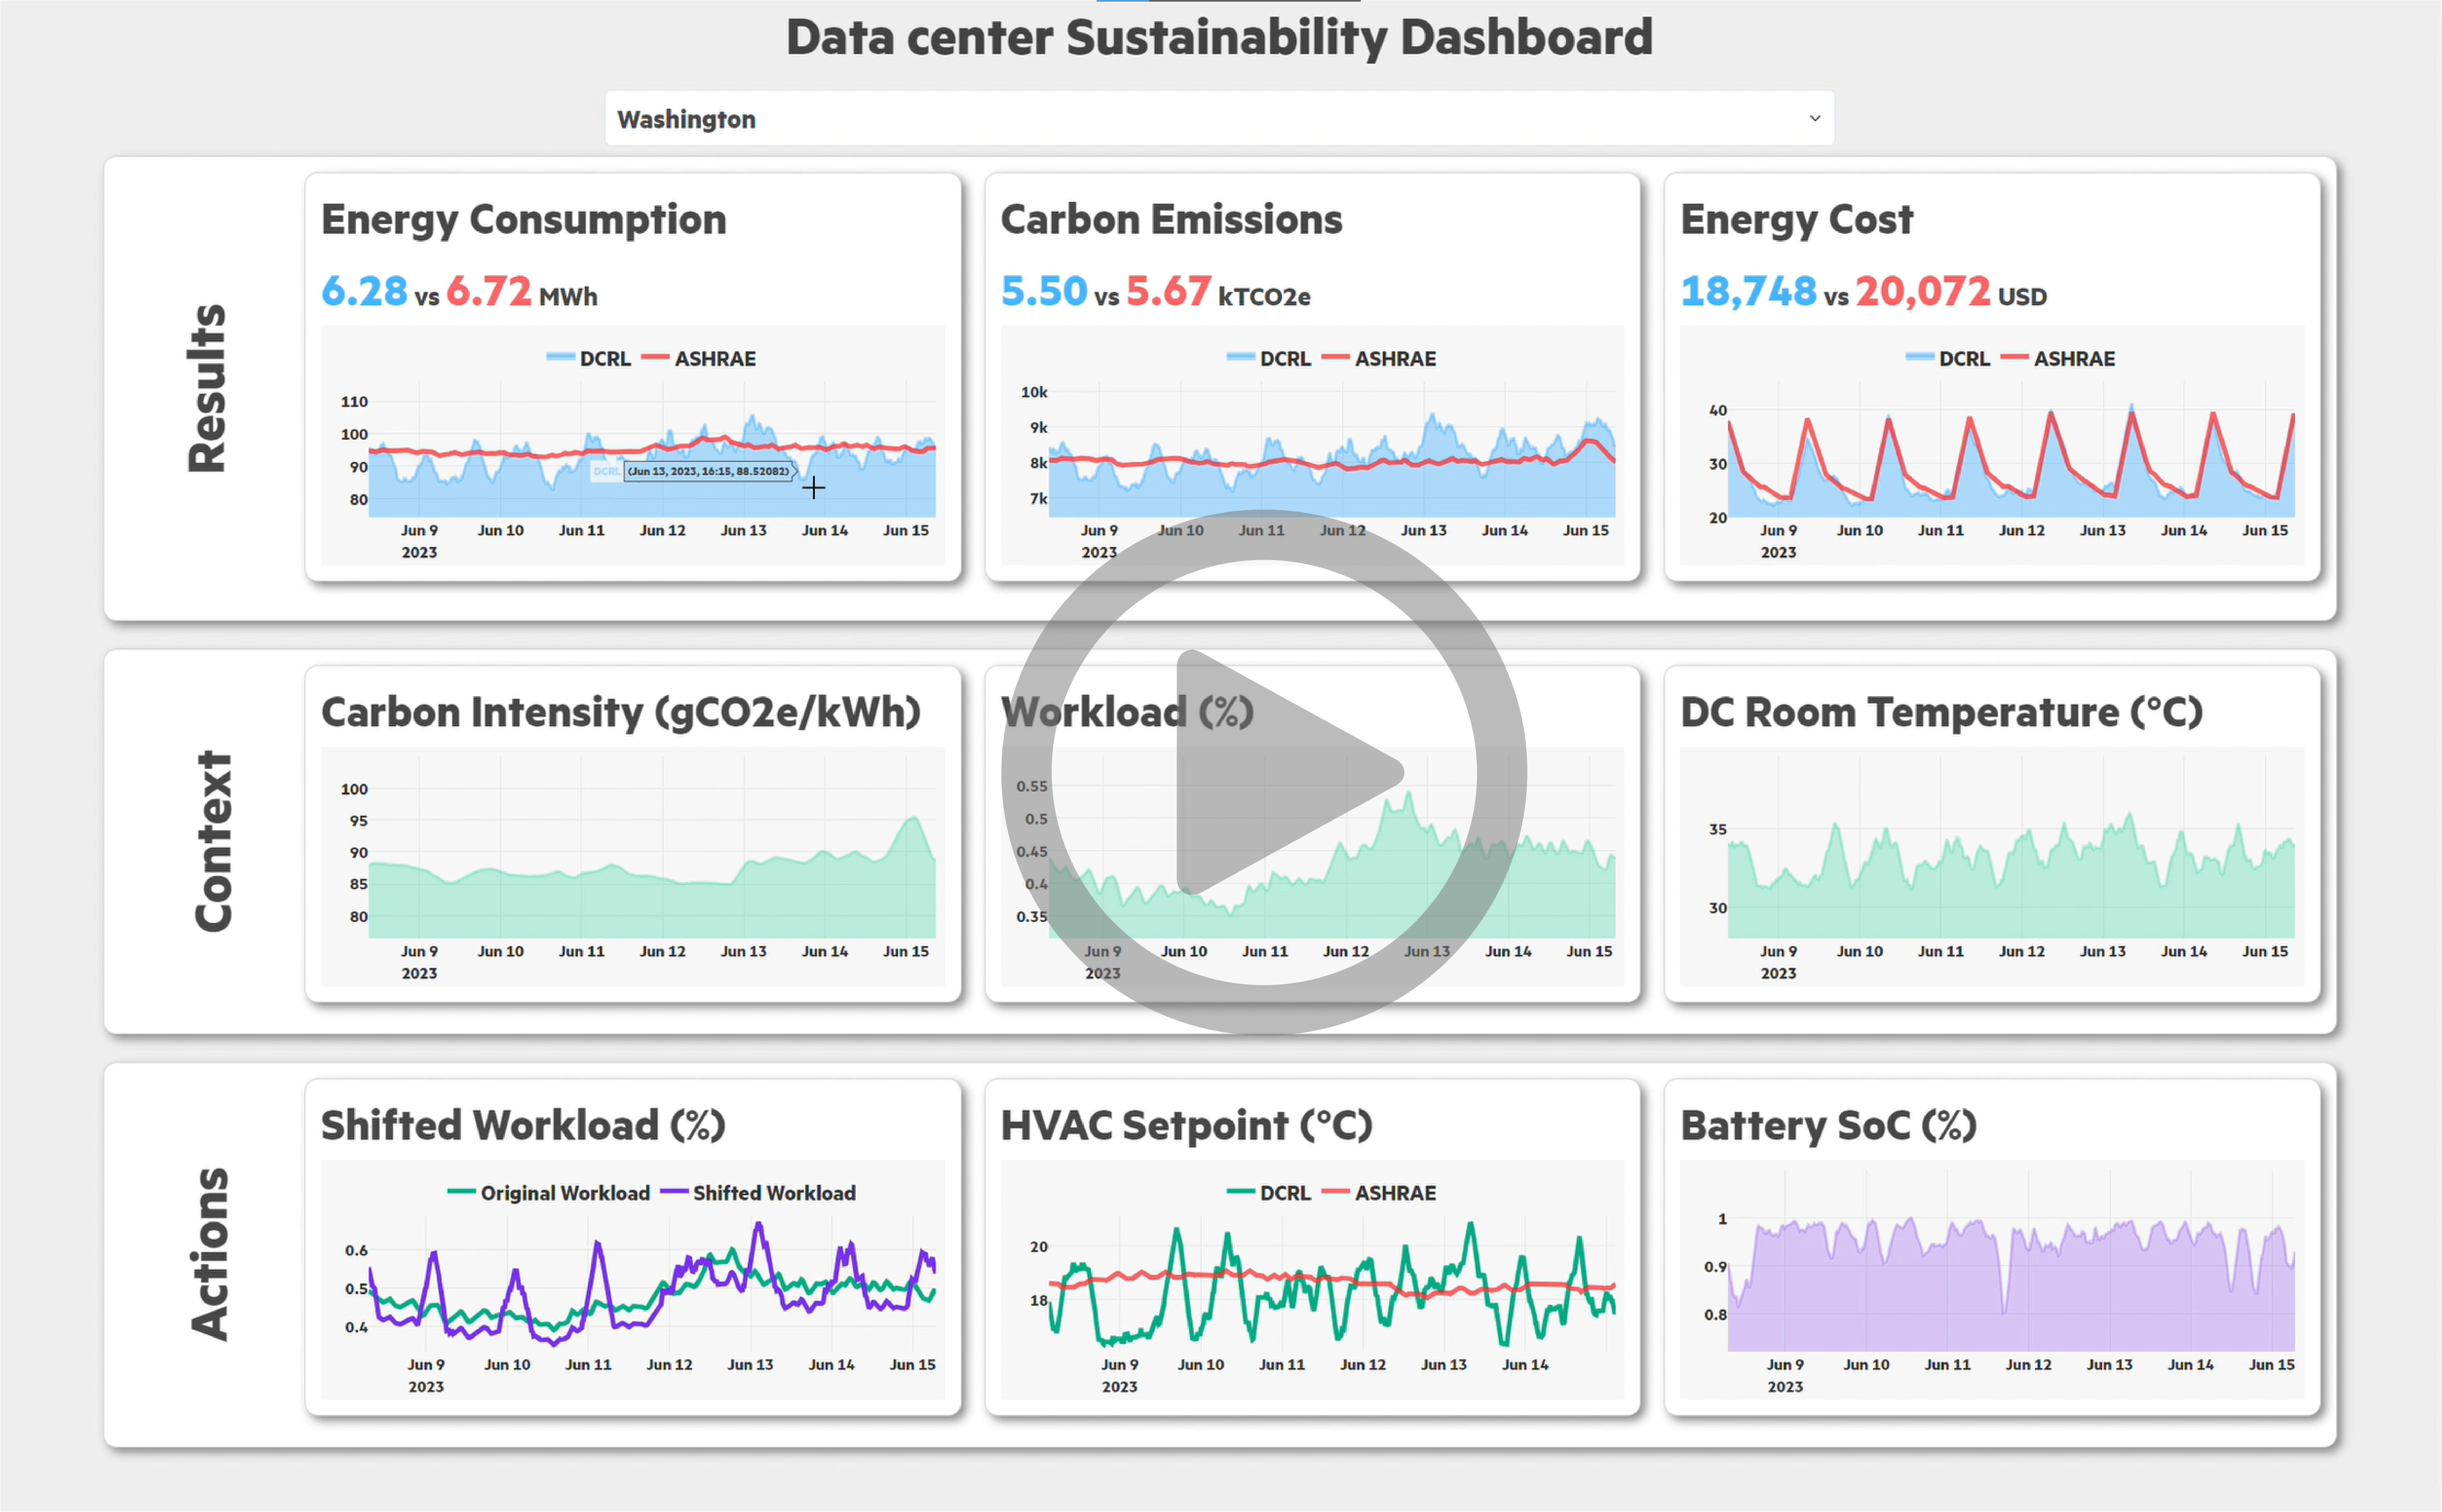
- In the video, you will see:
Real-time plotting of agent variables: Watch how the agents’ actions and states are visualized dynamically
Environment metrics: Observe the DC’s performance metrics, including energy consumption, cooling requirements, and workload distribution
Interactive dashboard features: Learn about the various interactive elements of the dashboard that allow for detailed analysis and monitoring
If you wish to download the video directly, click here.
Evaluation Metrics
Some of the evaluation metrics implemented in SustainDC include:
Carbon Footprint (CFP): Cumulative carbon emissions over the evaluation period.
HVAC Energy: Energy consumed by the DC cooling system.
IT Energy: Energy consumed by the DC servers.
Water Usage: Efficient utilization of water for cooling.
Task Dropped: Number of dropped tasks due to workload scheduling.