External Input Data
SustainDC uses external input data to provide a realistic simulation environment:
Workload
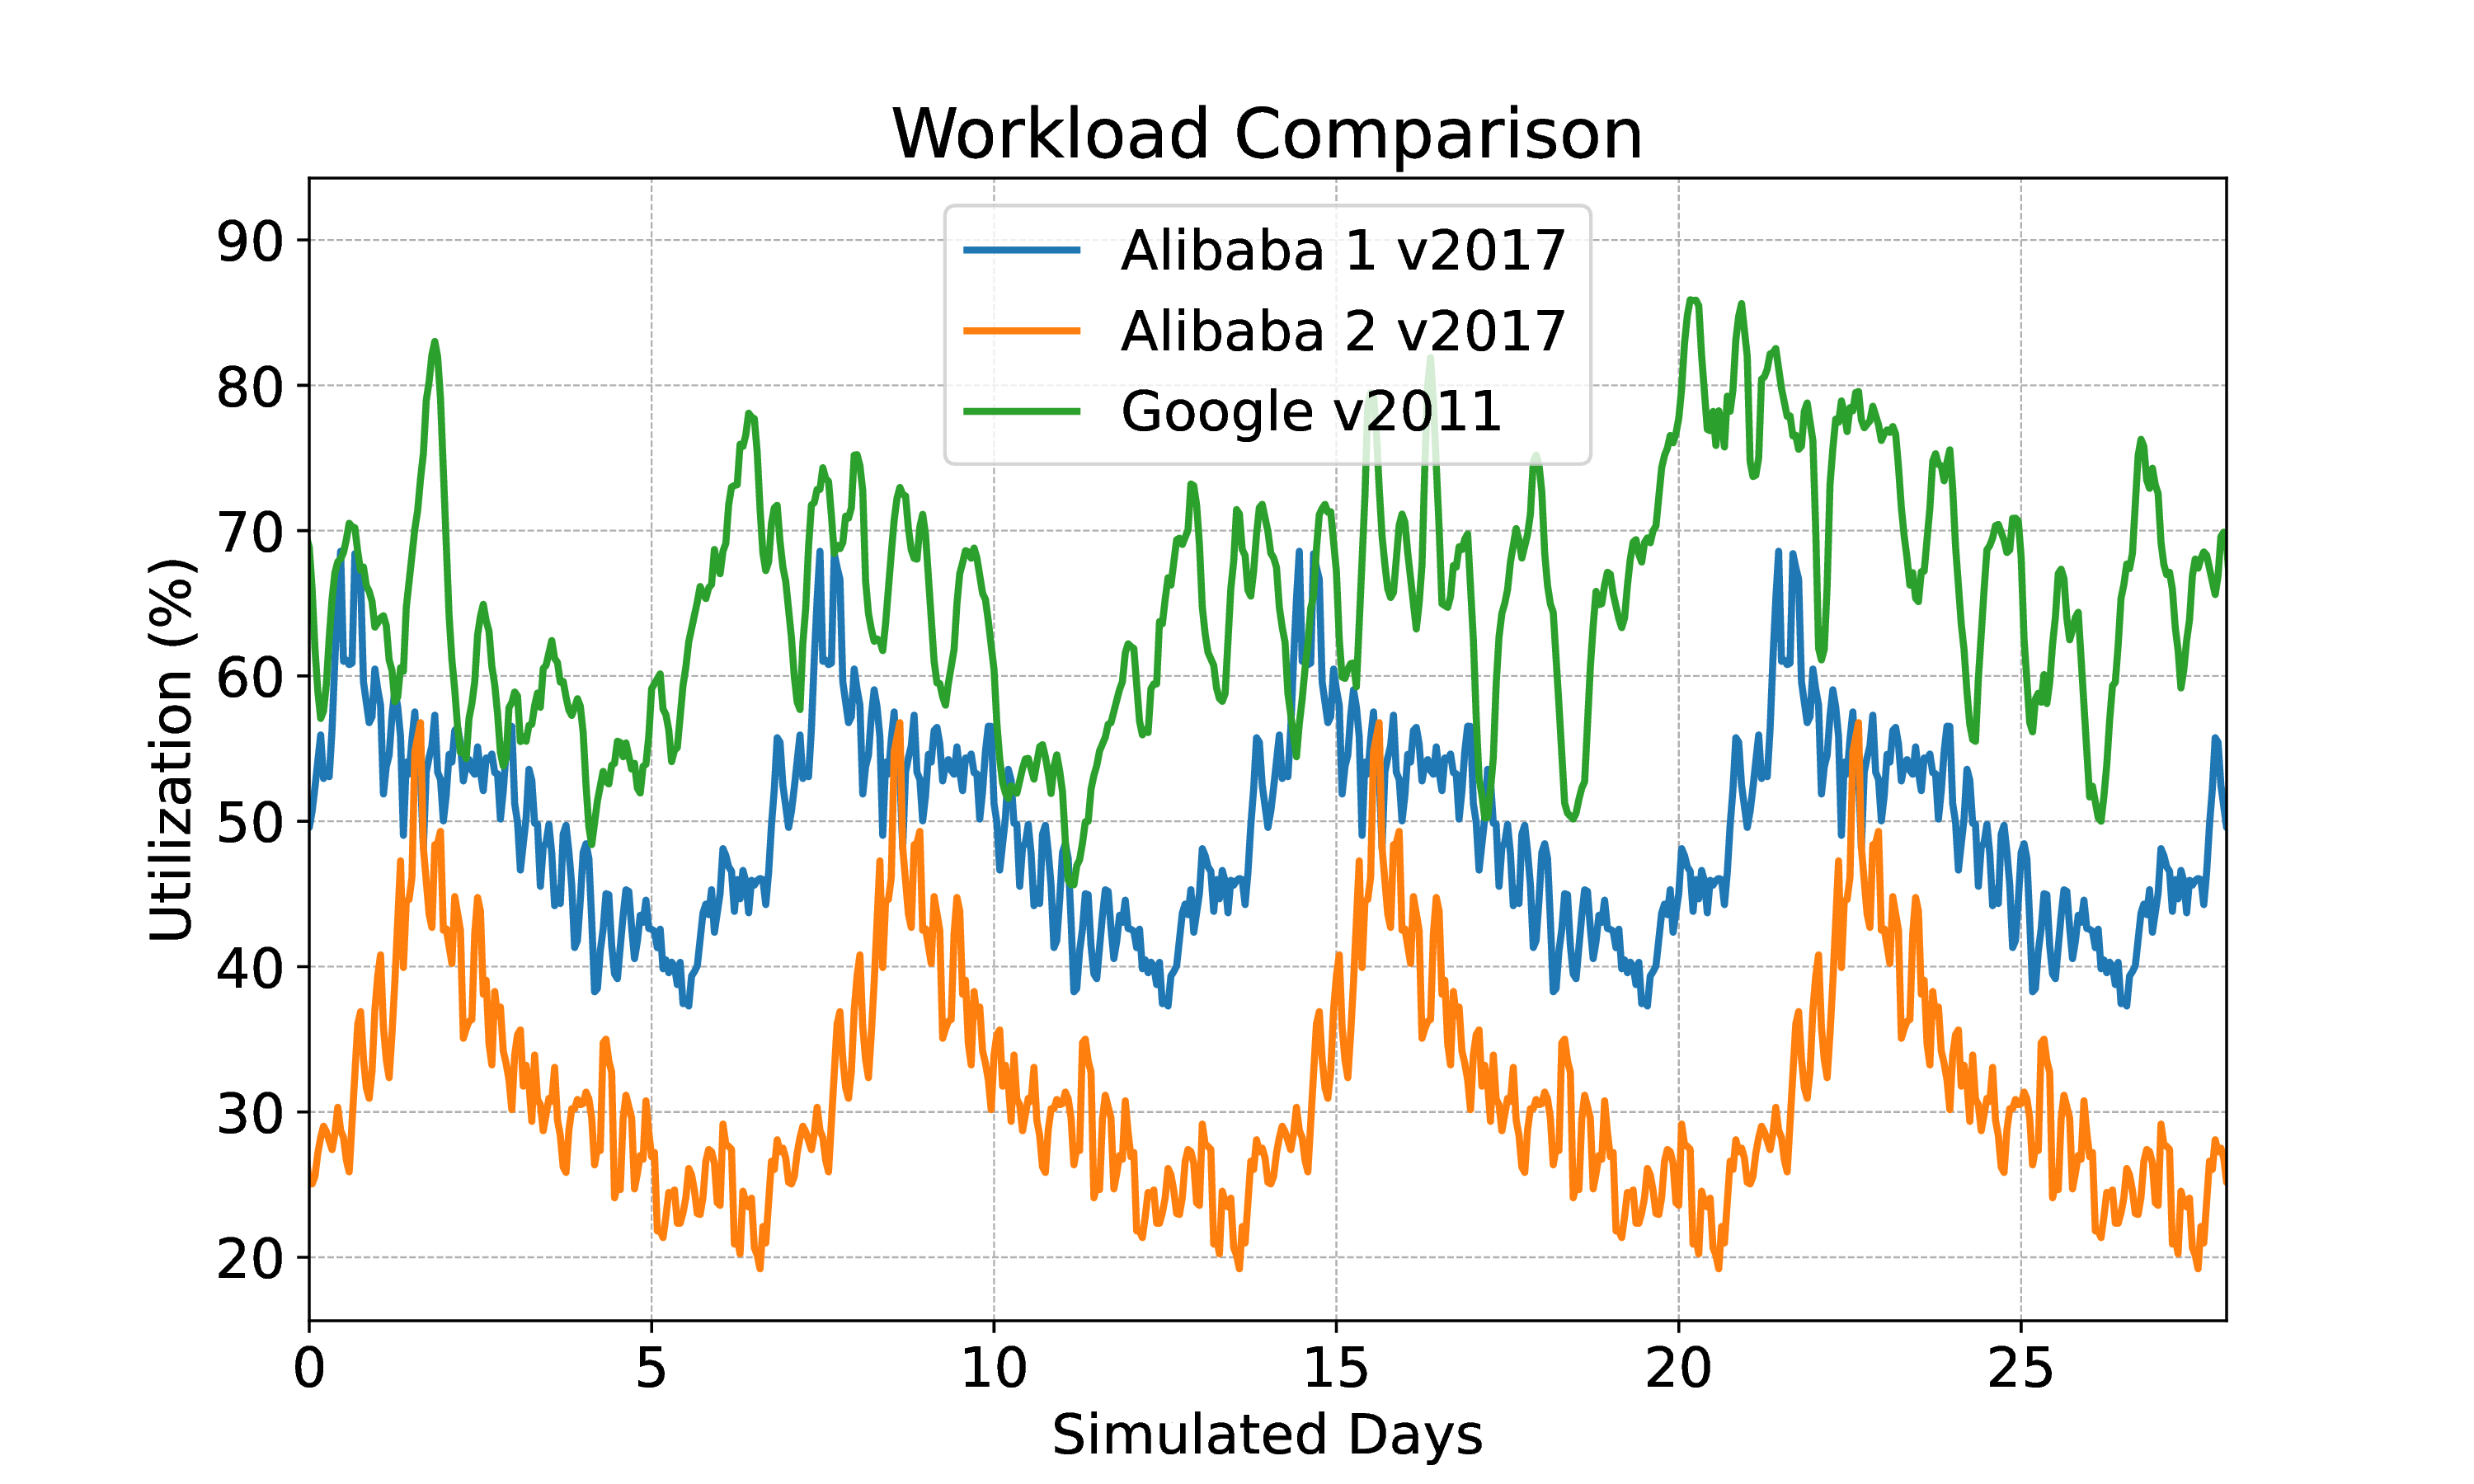
The Workload external data in SustainDC represents the computational demand placed on the DC. By default, SustainDC includes a collection of open-source workload traces from Alibaba and Google DCs.
Users can customize this component by adding new workload traces to the data/Workload folder or specifying a path to existing traces in the sustaindc_env.py file under the workload_file configuration. Comparison between two workload traces of Alibaba trace (2017) and Google (2011) is given in the figure below.
Weather
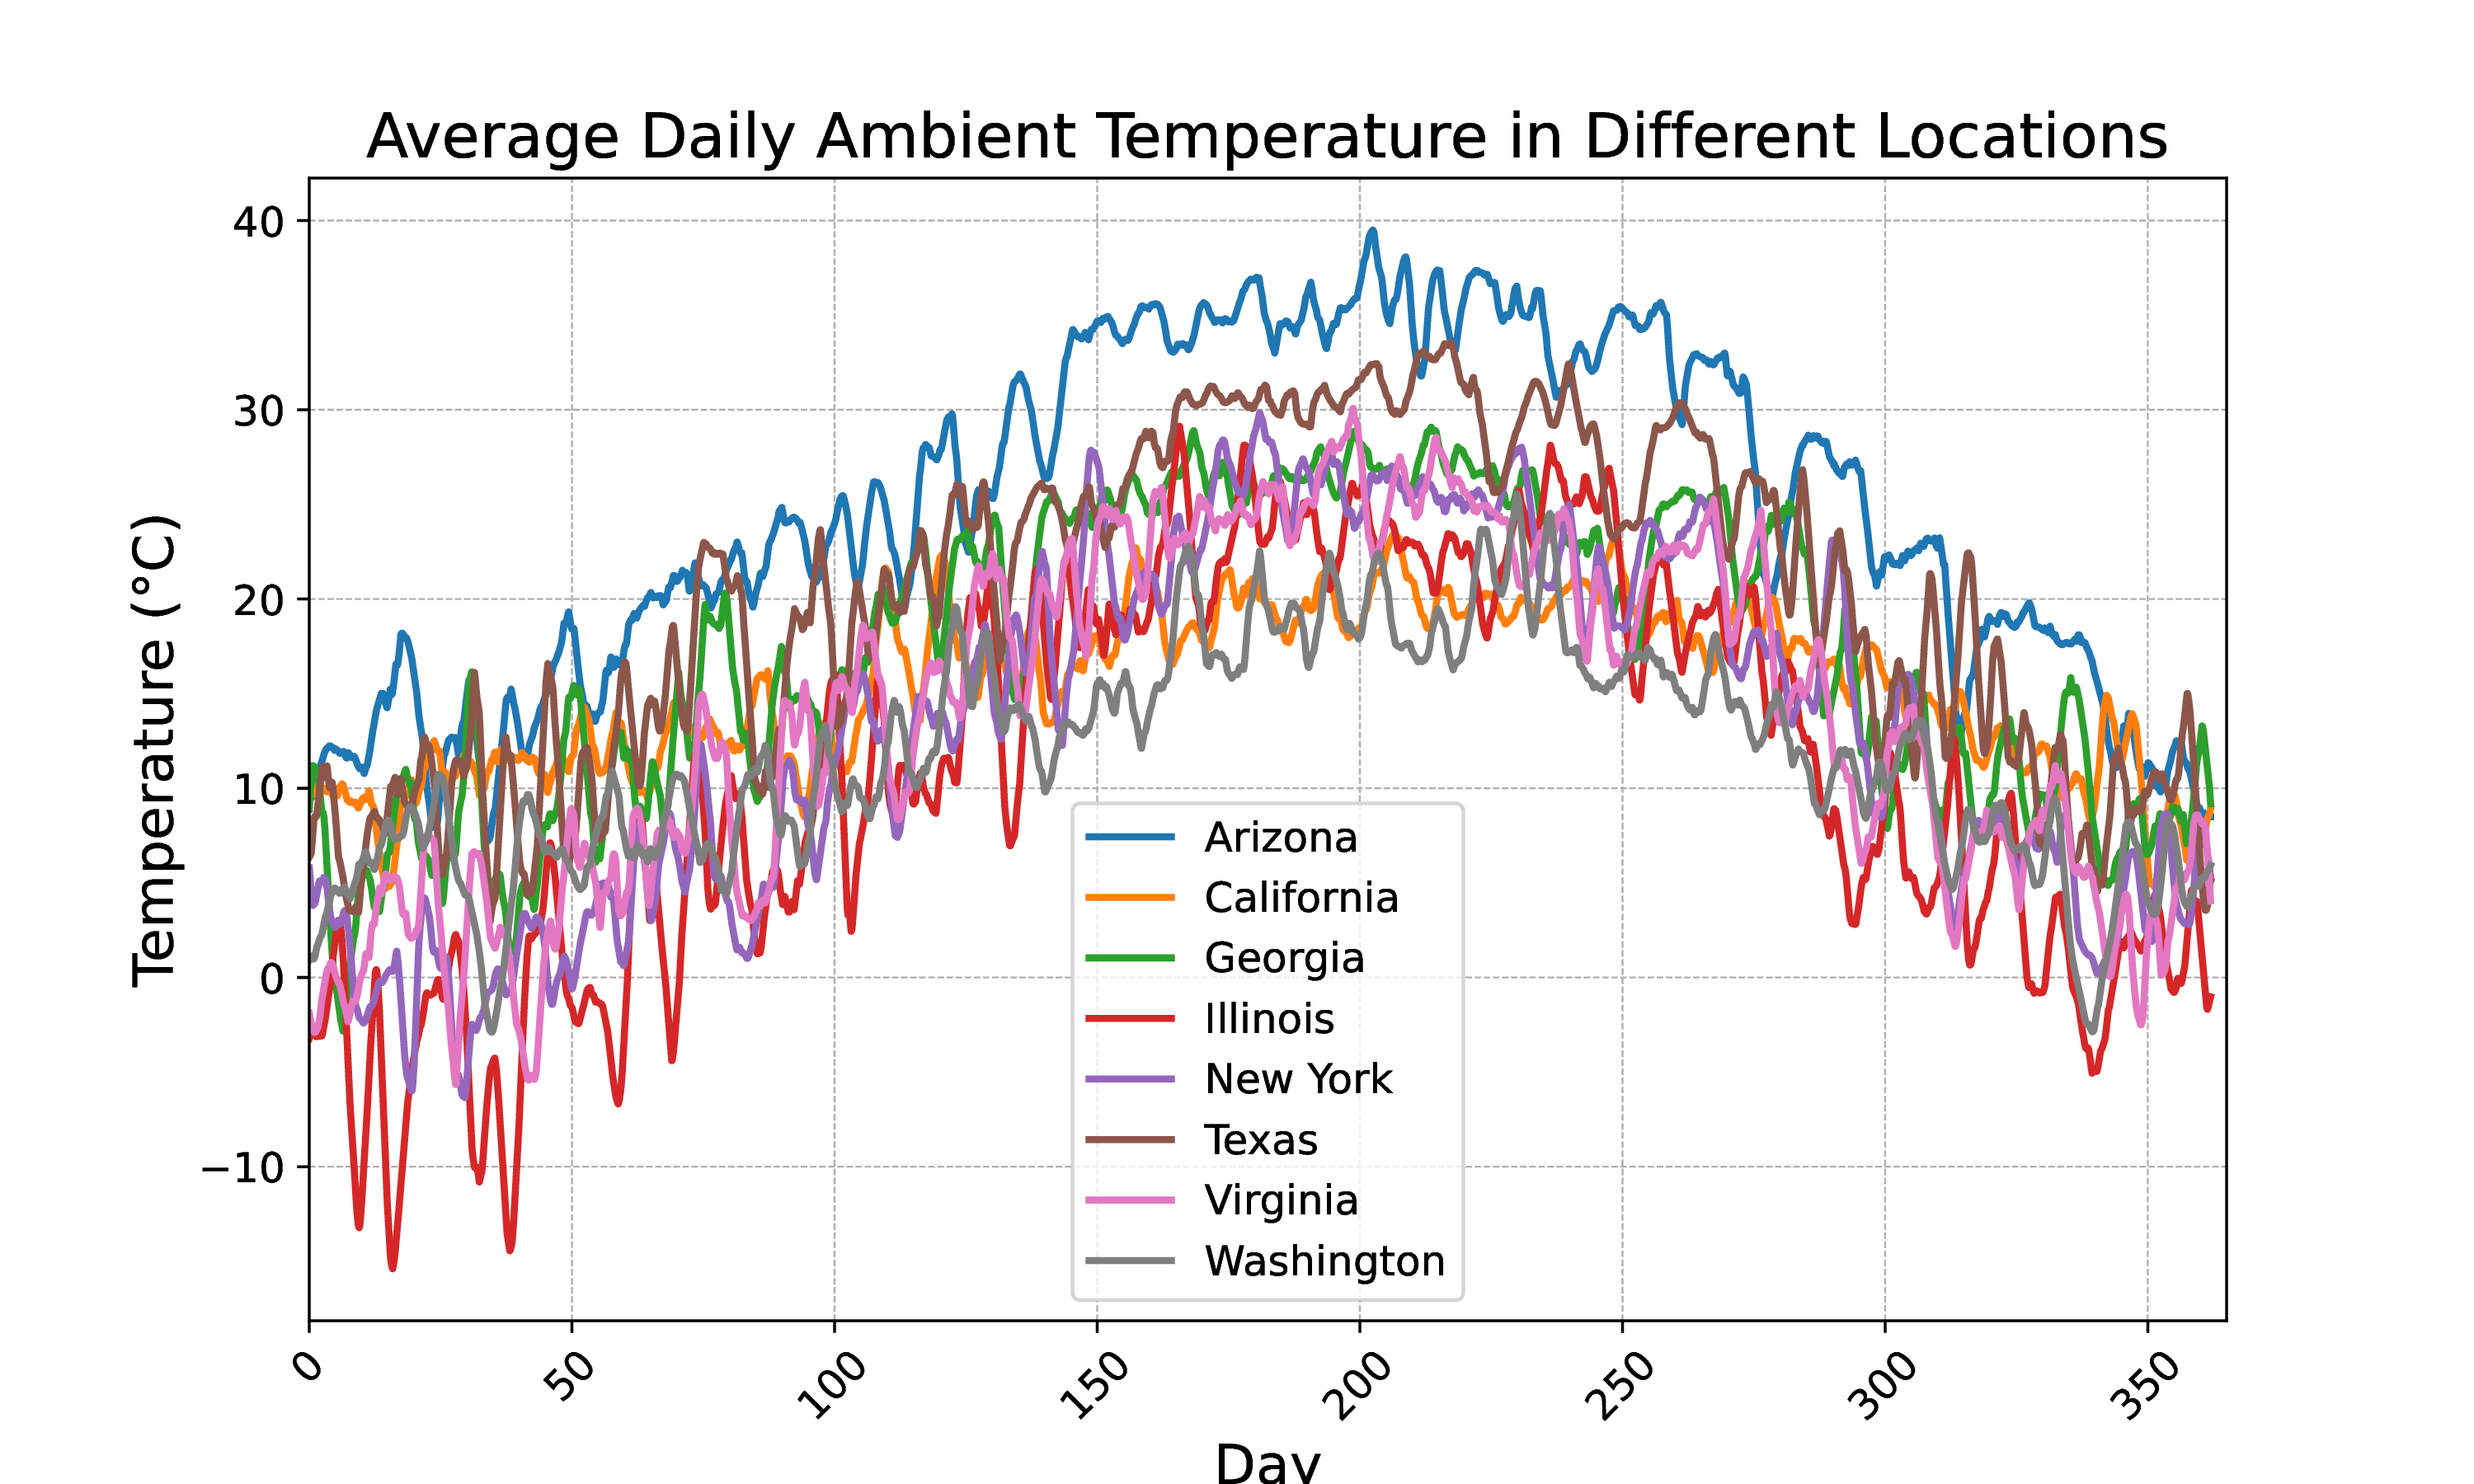
The Weather external data in SustainDC captures the ambient environmental conditions impacting the DC’s cooling requirements. By default, SustainDC includes weather data files in the .epw format from various locations where DCs are commonly situated. These locations include Arizona, California, Georgia, Illinois, New York, Texas, Virginia, and Washington.
Users can customize this component by adding new weather files to the data/Weather folder or specifying a path to existing weather files in the sustaindc_env.py file under the weather_file configuration.
Each .epw file contains hourly data for various weather parameters, but for our purposes, we focus on the ambient temperature. Comparison between external temperature of the different selected locations is given below.
Carbon Intensity
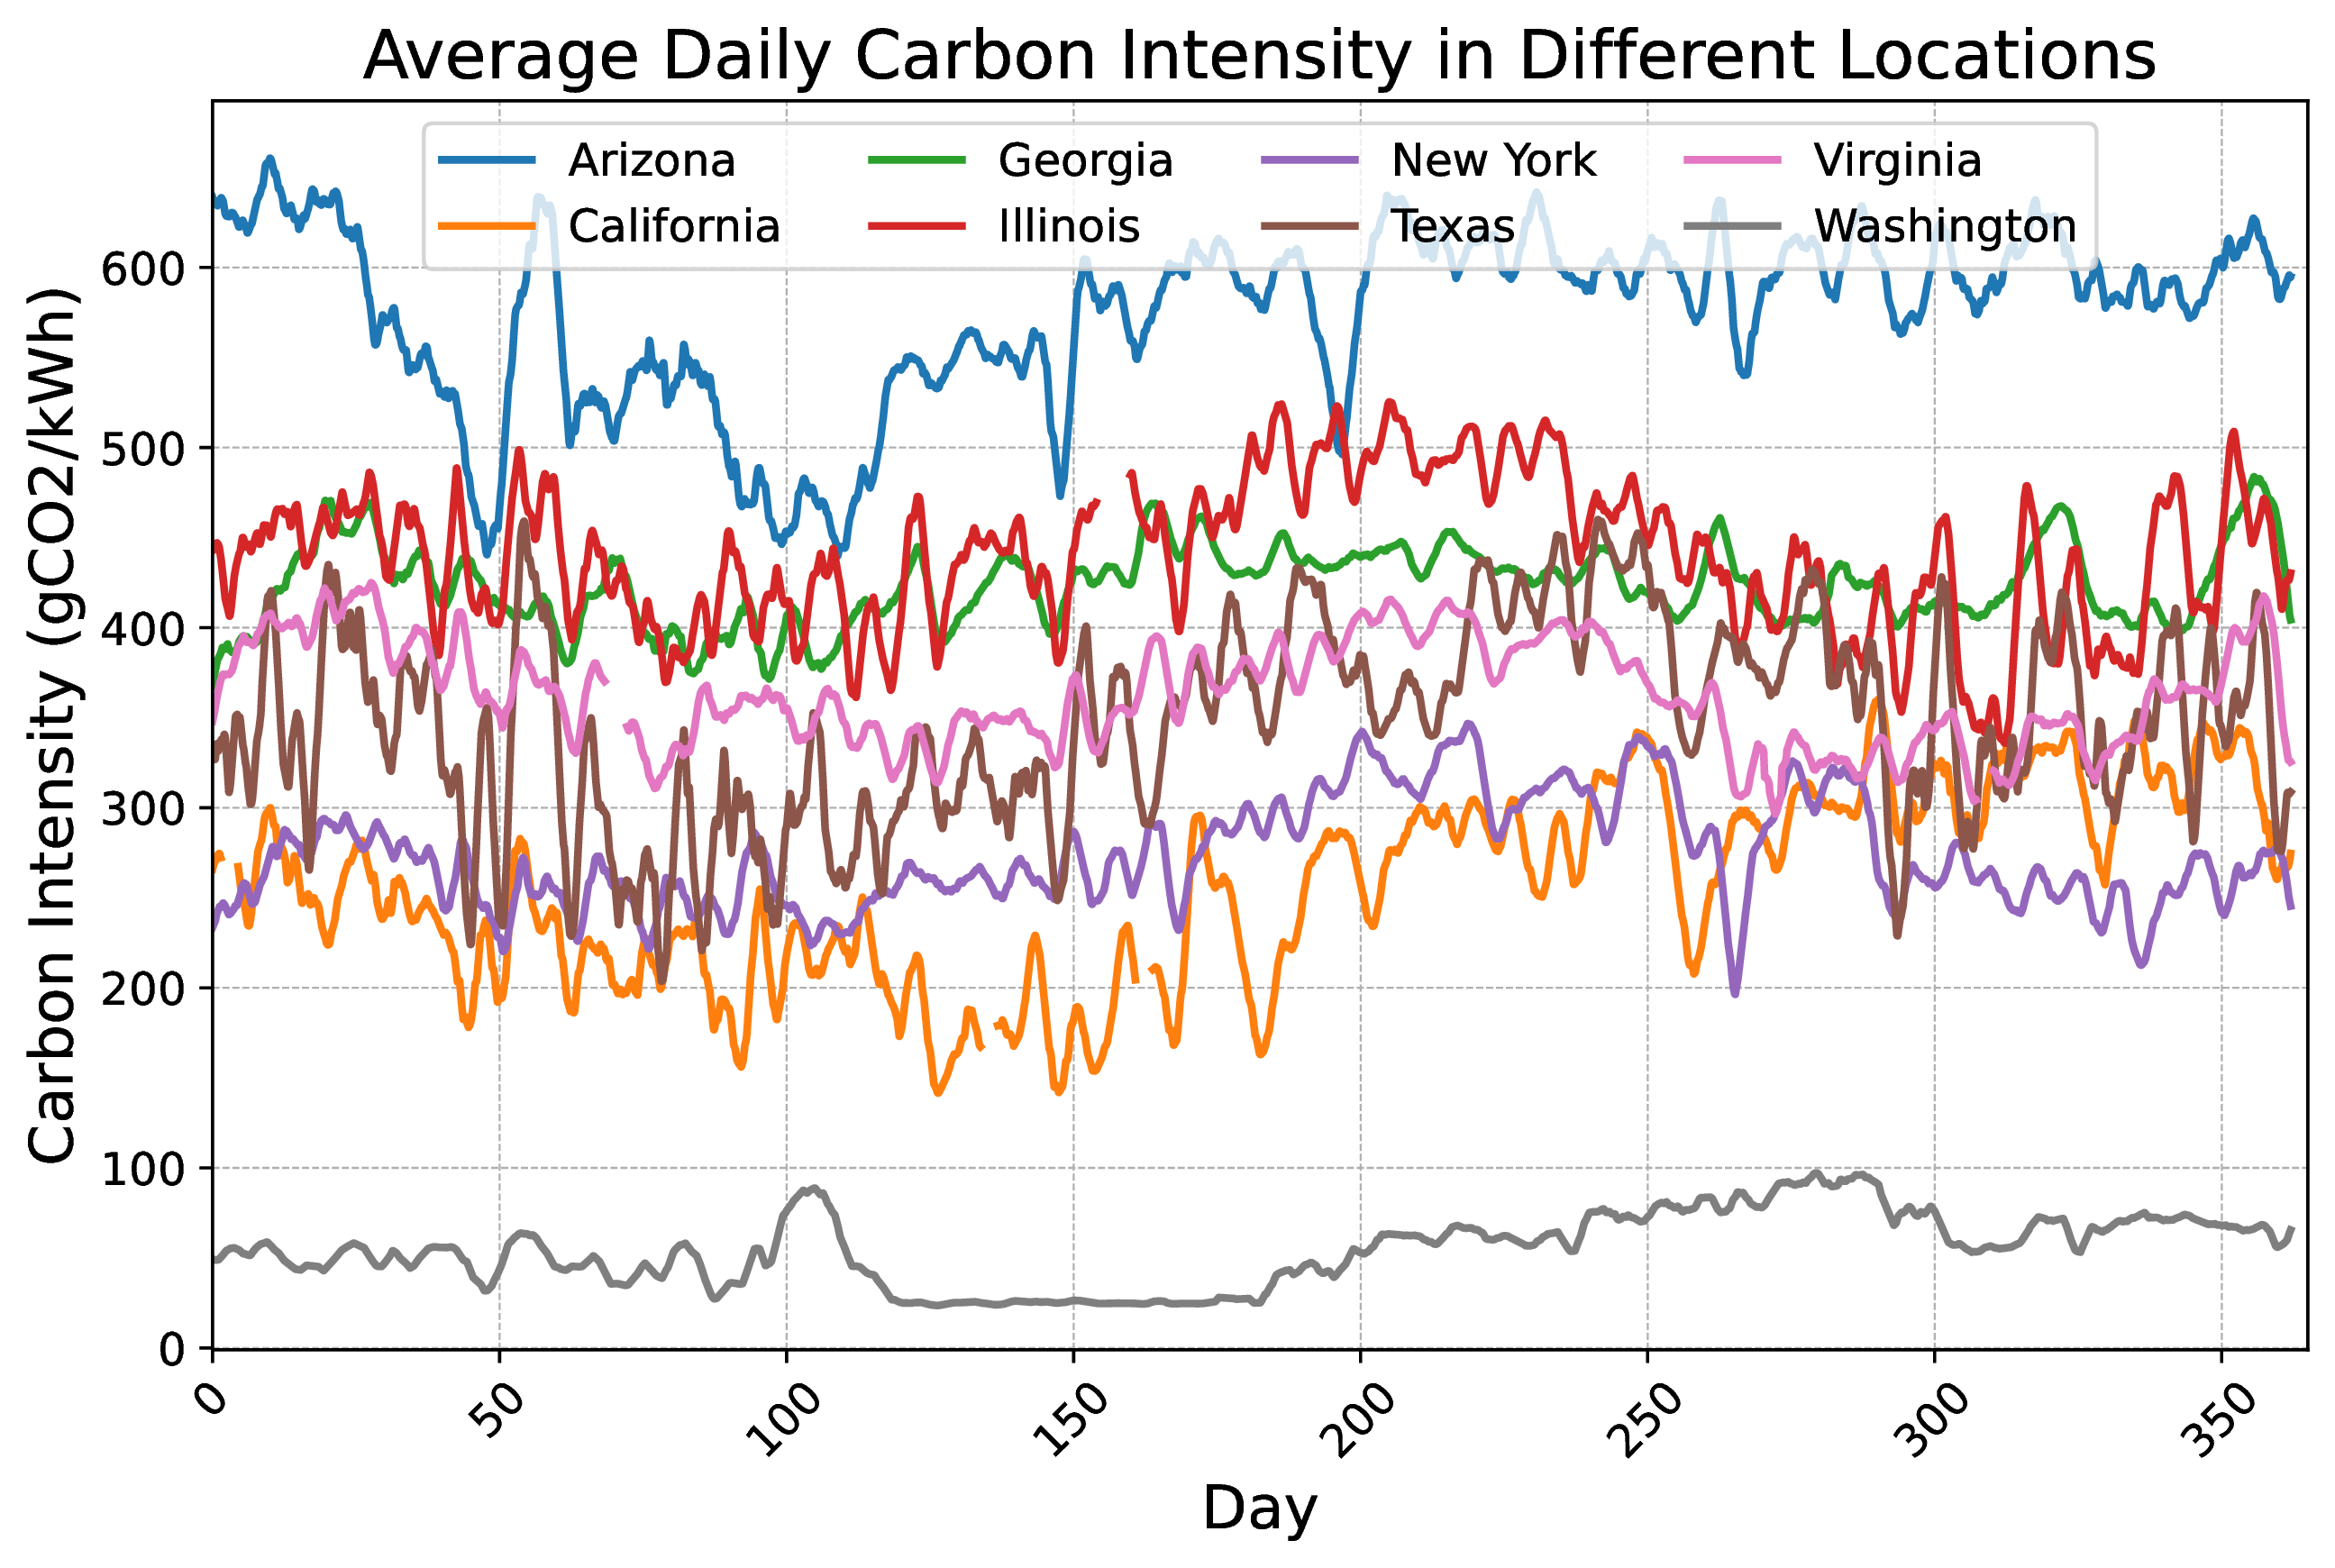
The Carbon Intensity (CI) external data in SustainDC represents the carbon emissions associated with electricity consumption. By default, SustainDC includes CI data files for various locations: Arizona, California, Georgia, Illinois, New York, Texas, Virginia, and Washington. These files are located in the data/CarbonIntensity folder and are extracted from this zip file.
Users can customize this component by adding new CI files to the data/CarbonIntensity folder or specifying a path to existing files in the sustaindc_env.py file under the cintensity_file configuration. Comparison of carbon intensity across the different selected locations is given in the figure below
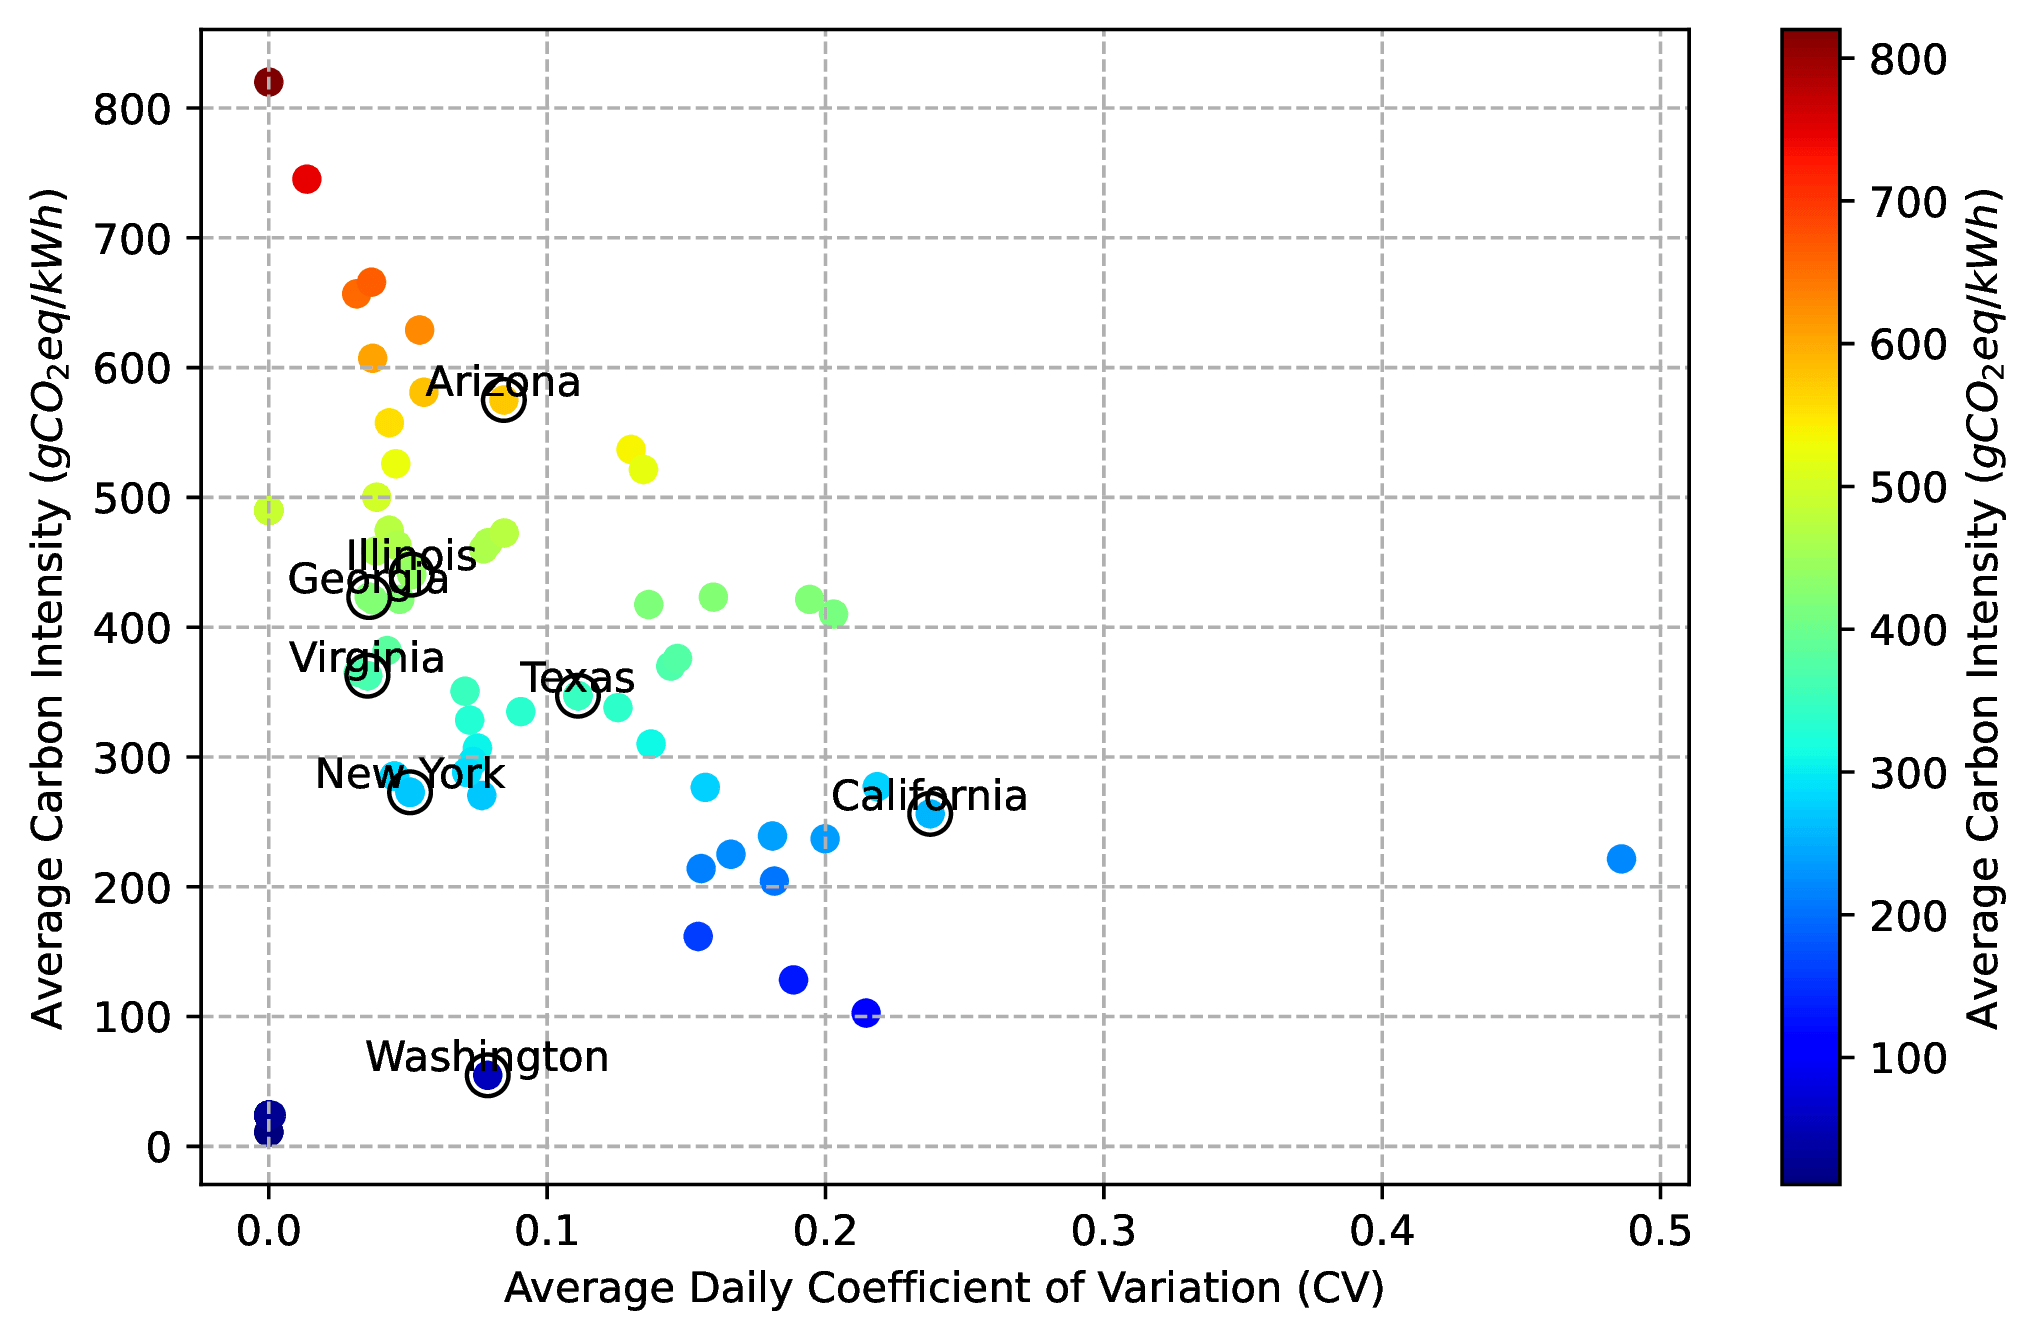
Furthermore, in the figure below, we show the average daily carbon intensity against the average daily coefficient of variation (CV) for various locations. This figure highlights an important perspective on the variability and magnitude of carbon intensity values across different regions. Locations with a high CV indicate greater fluctuation in carbon intensity, offering more “room to play” for DRL agents to effectively reduce carbon emissions through dynamic actions. Additionally, locations with a high average carbon intensity value present greater opportunities for achieving significant carbon emission reductions. The selected locations are highlighted, while other U.S. locations are also plotted for comparison. Regions with both high CV and high average carbon intensity are identified as prime targets for DRL agents to maximize their impact on reducing carbon emissions.
Below is a summary of the selected locations, typical weather values, and carbon emissions characteristics:
Location |
Typical Weather |
Carbon Emissions |
|---|---|---|
Arizona |
Hot, dry summers; mild winters |
High avg CI, High variation |
California |
Mild, Mediterranean climate |
Medium avg CI, Medium variation |
Georgia |
Hot, humid summers; mild winters |
High avg CI, Medium variation |
Illinois |
Cold winters; hot, humid summers |
High avg CI, Medium variation |
New York |
Cold winters; hot, humid summers |
Medium avg CI, Medium variation |
Texas |
Hot summers; mild winters |
Medium avg CI, High variation |
Virginia |
Mild climate, seasonal variations |
Medium avg CI, Medium variation |
Washington |
Mild, temperate climate; wet winters |
Low avg CI, Low variation |