Monitoring with Prometheus and Grafana on Docker swarm
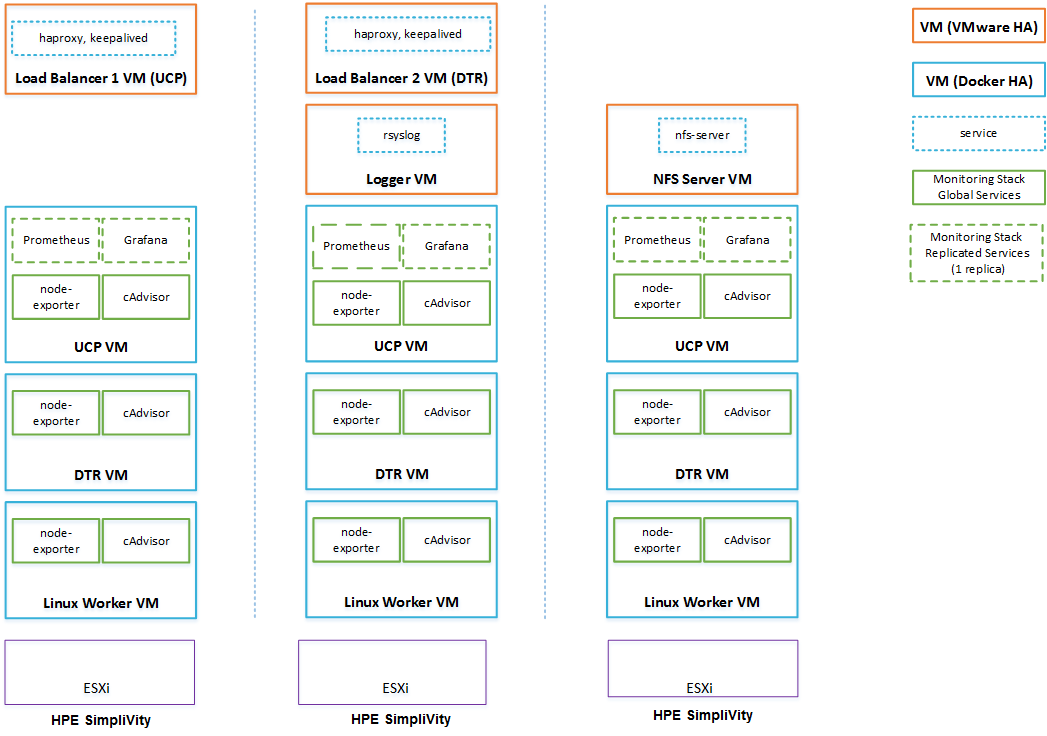
The solution can be configured to enable the use of Prometheus and Grafana for monitoring. In this setup, there is no need for native installs and all the required monitoring software runs in containers, deployed as either services or stacks. The load among the three hosts will be shared as per the following diagram.

Figure 18. Solution architecture: Linux workers with Prometheus and Grafana
The Prometheus and Grafana services are declared in a Docker stack as replicated services with one replica each, so if they fail, Docker EE will ensure that they are restarted on one of the UCP VMs. cAdvisor and node-exporter are declared in the same stack as global services, so Docker EE will ensure that there is always one copy of each running on every machine in the cluster.
Note: Prometheus and Grafana functionality is not turned on by default in this solution - see the section on Configuration for more information on how to enable these tools. Additionally, this functionality will not work for the Windows worker nodes in your environment at present.