Accessing Grafana UI
The Grafana UI is available at the UCP VIP, using HTTP on port 3000, for example,
http://hpe-ucpvip.am2.cloudra.local:3000
The default username and password for Grafana is admin/admin. The first time you login, you will be asked to reset the default admin password.
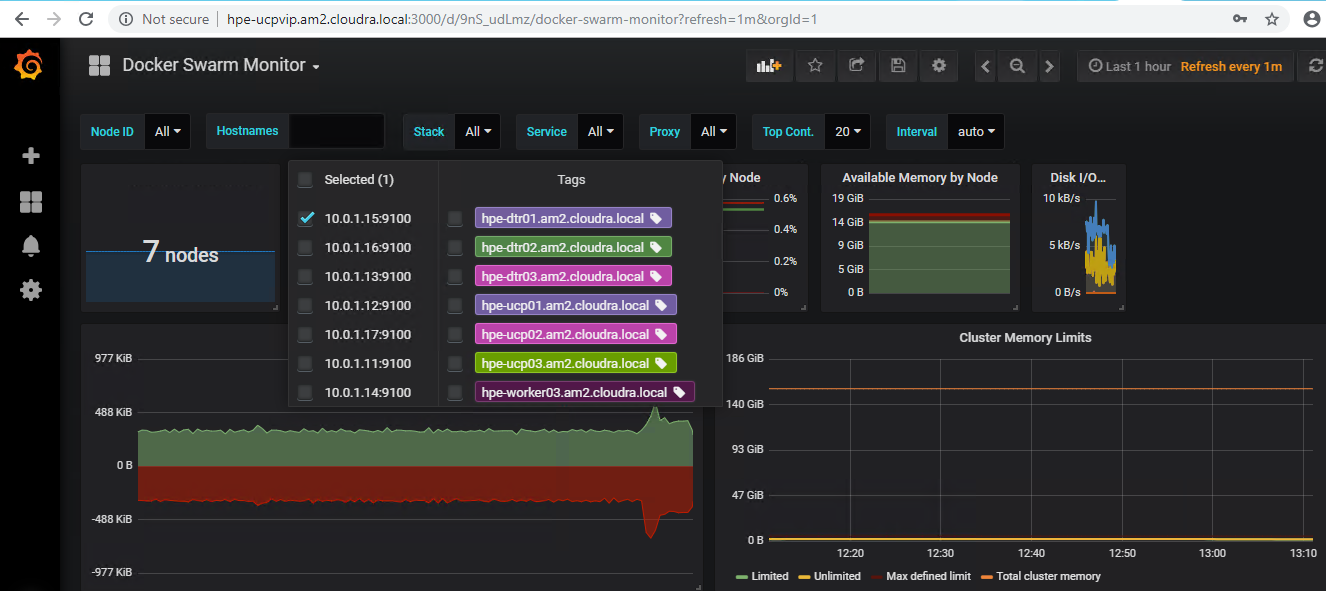
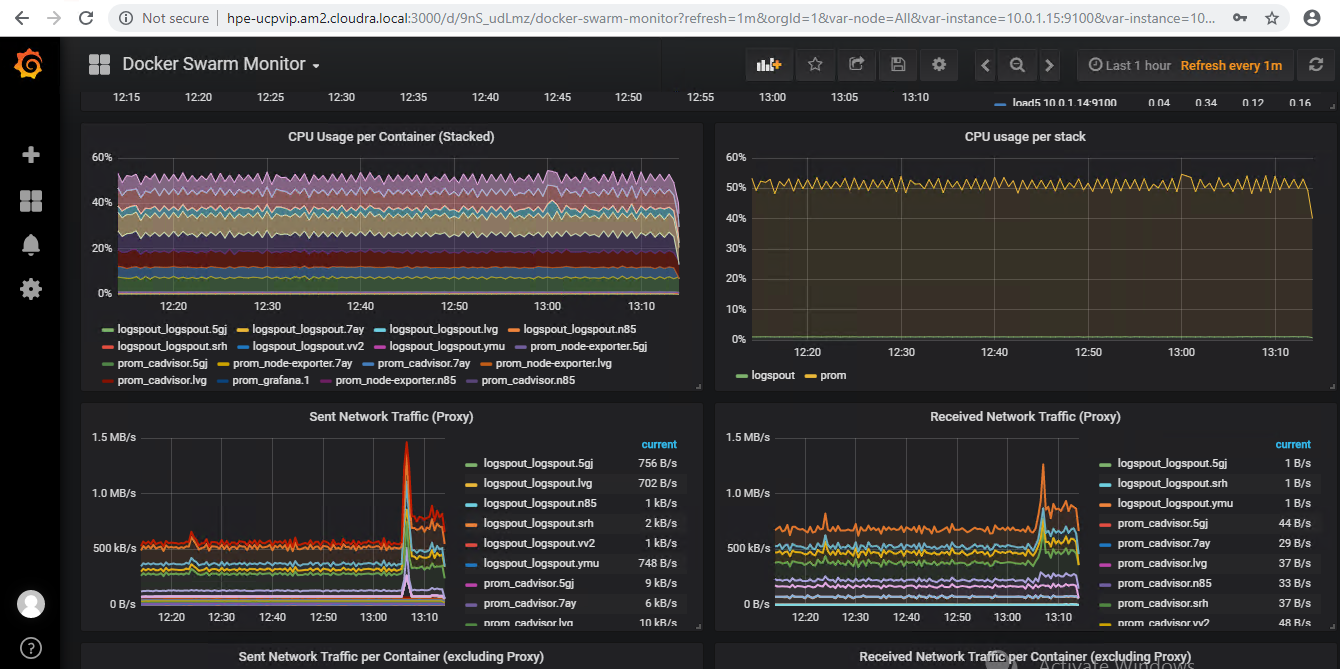
Select the Docker Swarm Monitor dashboard that has already been loaded by the playbooks, as shown in Figures 19 and 20.

Figure 19. Docker Swarm Monitor

Figure 20. Docker Swarm Monitor