# Integration of HPE OneView with Prometheus
# Overview
This document contains details of integration of HPE OneView with Prometheus operator on an existing Red Hat OpenShift Container Platform 4.
# HPE OneView Syslog library
The HPE OneView syslog generator repo helps in getting the alerts of HPE OneView alerts into a syslog. This is a python- based solution and uses HPE OneView APIs (REST and Message queues (SCMB)) to get the alerts and stats that converts into syslog. This syslog can be forwarded and consumed by log- readable monitoring solutions in Prometheus.
The library is a config driver, which allows user to filter the alerts based on severity and hardware resources.
Primarily, this library generates syslog for the following:
- Events generated from HPE OneView.
- Interconnect statistics (Port transmit/Receive/Speed/Model).
- Enclosure statistics (Temperature/Power).
- Server statistics (Temperature/Power/CPU frequency/CPU utilization).
- Remote support ticket information.
Prerequisites for Syslog library
- Availability of the latest OpenShift Container Platform 4.4.x cluster.
- Creation of host path "/mnt/oneview-syslog-lib" in all worker nodes.
- Install helm chat in OpenShift.
# Deploying HPE OneView Syslog pod on an existing pod with Red Hat OpenShift Container Platform
Download HPE OneView syslog packages from the following GitHub link. https://github.hpe.com/GSE/ov-prometheus-grafana/tree/master/oneview_syslog_lib (opens new window)
Use the following base64 command to generate an encoded password for HPE OneView.
$ printf '%s' Password' | base64Update HPE OneView IP address, username and the encoded password in "/oneview_syslog_lib /config.json" and update the same details in "/oneview_syslog_lib/helm/log-generator/templates/config-map.yaml". This is done in accordance with the needs of the customer.
Note
Use step 4 and step 5 to create your own Docker images.
Build your own docker image using Docker file as shown and push images to your Docker Hub.
$ cd to oneview_syslog_lib

docker build -t <org>/oneview-syslog-lib:<tag>.

$ cd to grok_exporter

docker build -t <org name>/grok-exporter:<tag>.
Update both HPE OneView-syslog-lib and grok-exporter docker images on deployment.yaml in container section.
containers:

- name: oneview-syslog-lib

image: "John/oneview-syslog-lib:v10.0"

containers:

- name: oneview-grok-exporter

image: "John/grok-exporter:v2.0"
From OpenShift CLI, login to default project.
Create Persistent volume (PV) and Persistent Volume Claim (PVC) and verify whether both of them are bounded properly.
$ oc create -f ov-syslog-pv.yaml

$ oc create -f ov-syslog-pvc.yaml
Navigate to oneview_syslog_lib and run the following commands.
helm install helm/log-generatorVerify the status of HPE OneView-syslog-lib pod. Figure 26 shows the output after the helm install HPE OneView-syslog-lib pod status.

Figure 26. HPE OneView-syslog-lib pod output
# Installation of Prometheus operator on an existing Red Hat OpenShift Container Platform
Logon to the Red Hat OpenShift Container Platform web console.
Click Operators→ OperatorHub.
Search for Prometheus Operator from the list of operators and click it.
On the Prometheus Operator page, click install.
On the Create Operator Subscription page, select namespace as default in Installation Mode, Update Channel and Approval Strategy options. Figure 27 shows the output of Prometheus operator install process.
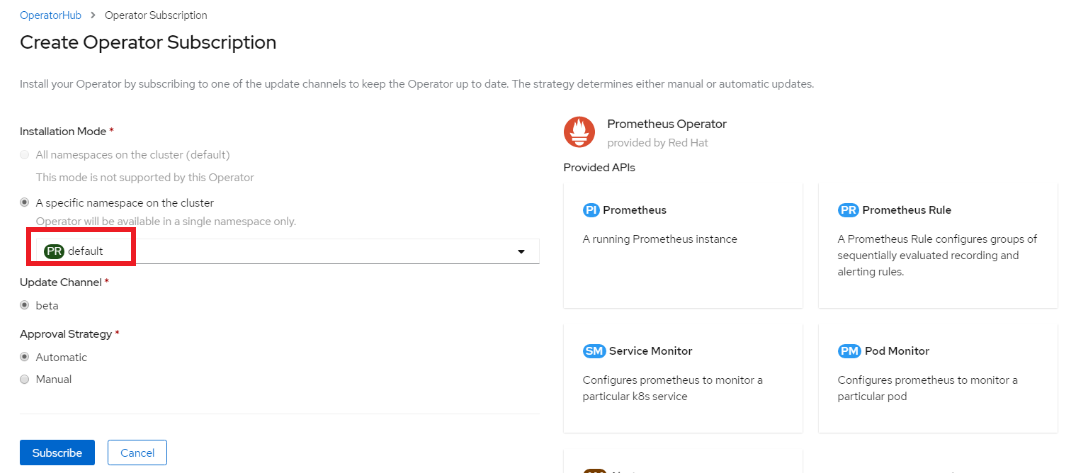
Figure 27. Prometheus Operator install process
- Click Subscribe. The Installed Operators page is displayed with the status of the operator. Figure 28 shows the output of Prometheus operator status.
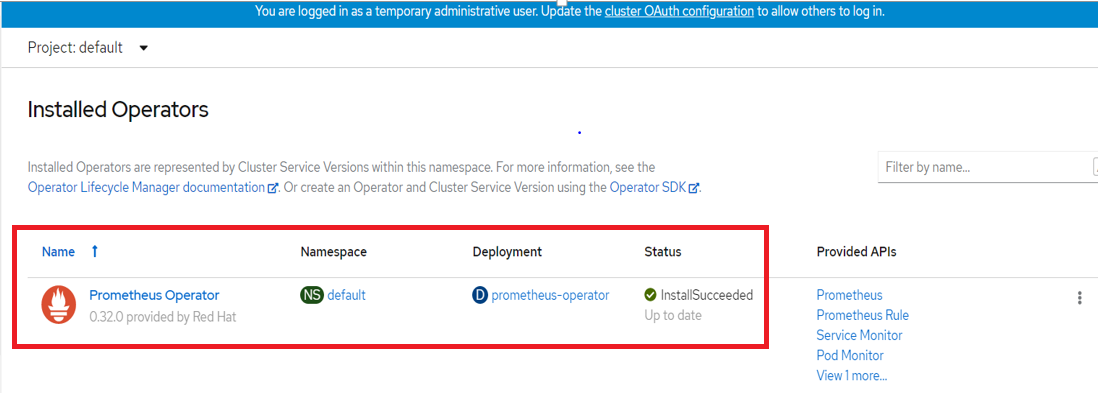
Figure 28. Prometheus Operator install status
# Integration of OneView Syslog pod with Prometheus on an existing Red Hat OpenShift Container Platform
Click Operators → Installed Operators from the left pane of the OpenShift Web Console to view the installed operators.
On the Installed Operator page, select Prometheus Operator from the Project drop-down list to switch to the default project.
Click Prometheus Operator.
On the Prometheus Operator page, scroll right and go to Prometheus. Click Create Prometheus. Figure 29 shows the output for Prometheus service.
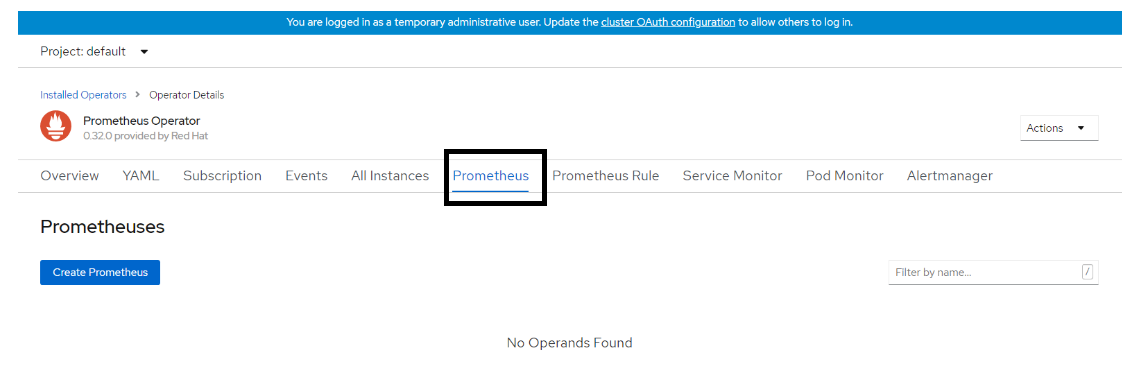
Figure 29. Prometheus service
- After clicking Create Prometheus, YAML file will be displayed. Click Create. Figure 20 shows the output for Prometheus service YAML.
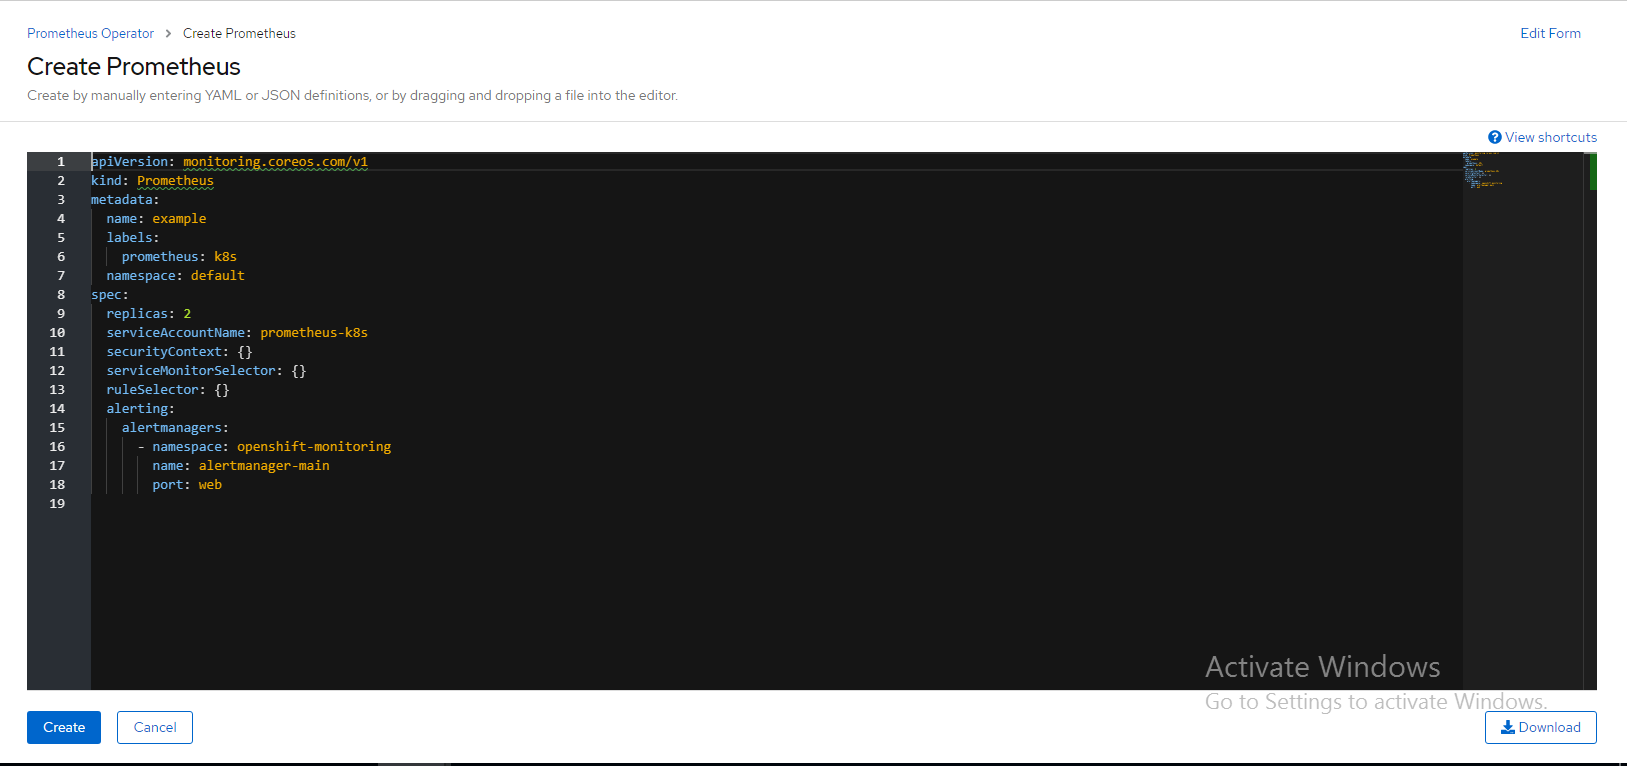
Figure 30. Prometheus service YAML
- On the Prometheus Operator page, scroll right and go to Service Monitor. Click Create Service Monitor. Figure 31 shows the output of Create Service Monitor.
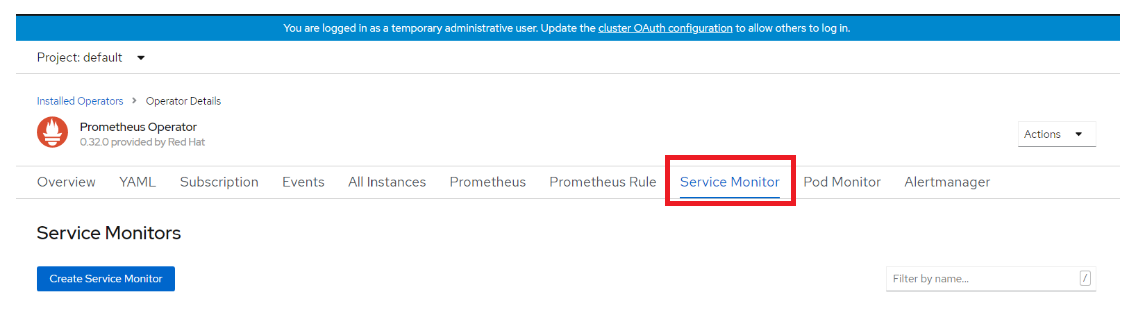
Figure 31. Create Service Monitor
After clicking Create Service Monitor, YAML file will be displayed and then change the required values in matchLabels section as app: log-generator , port: http, and interval: 10s.
Figure 32 shows the output for Create Service Monitor YAML.
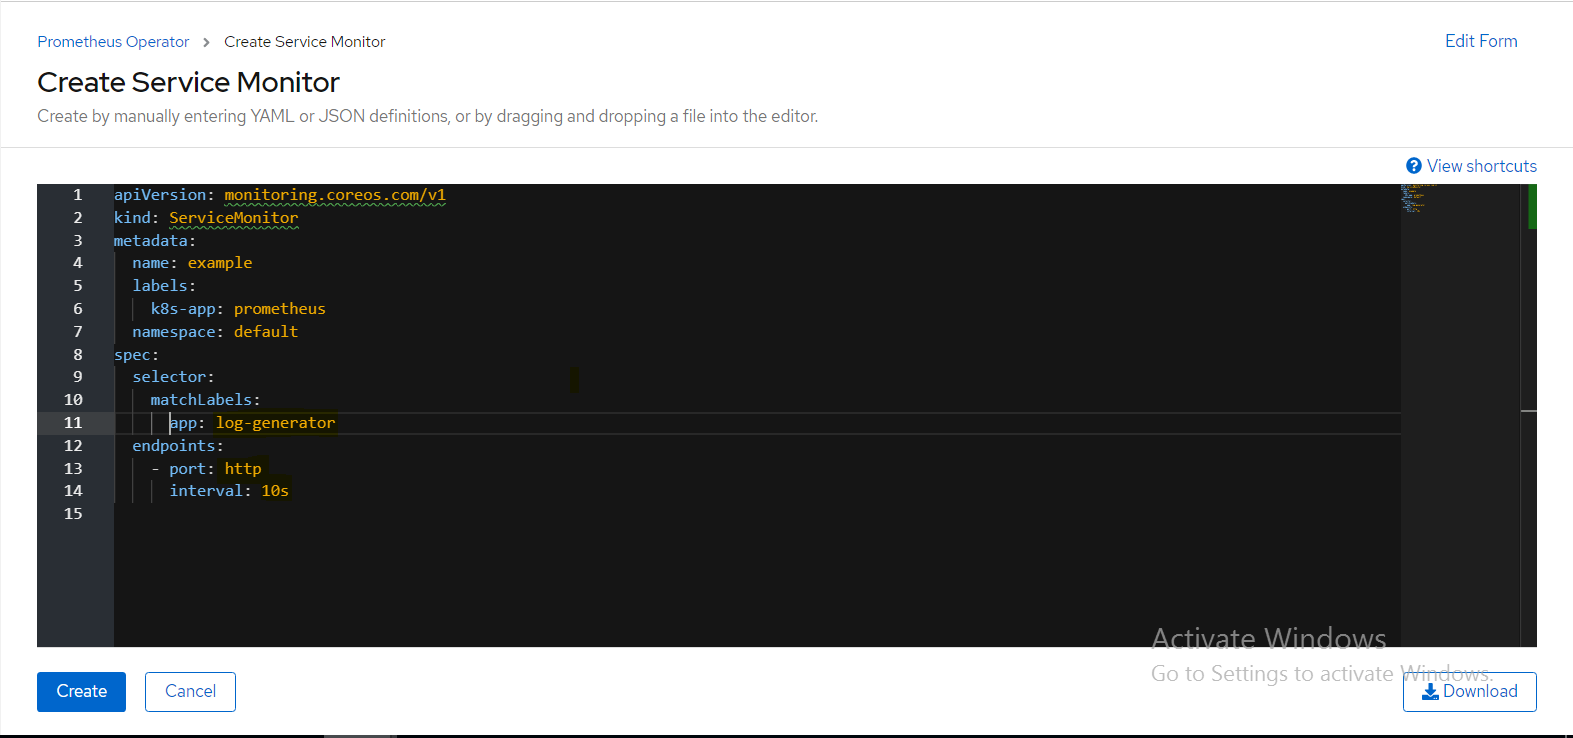
Figure 32. Service Monitor YAML
On the console page, navigate to Networking option. Click Routes option to open the Create Route page for Prometheus. Enter details for Name and Services. Select the Prometheus operator. Select the Target Port as 9090. Click Create to generate the Prometheus URL.Figure 33 shows the output for Create Prometheus operator URL.
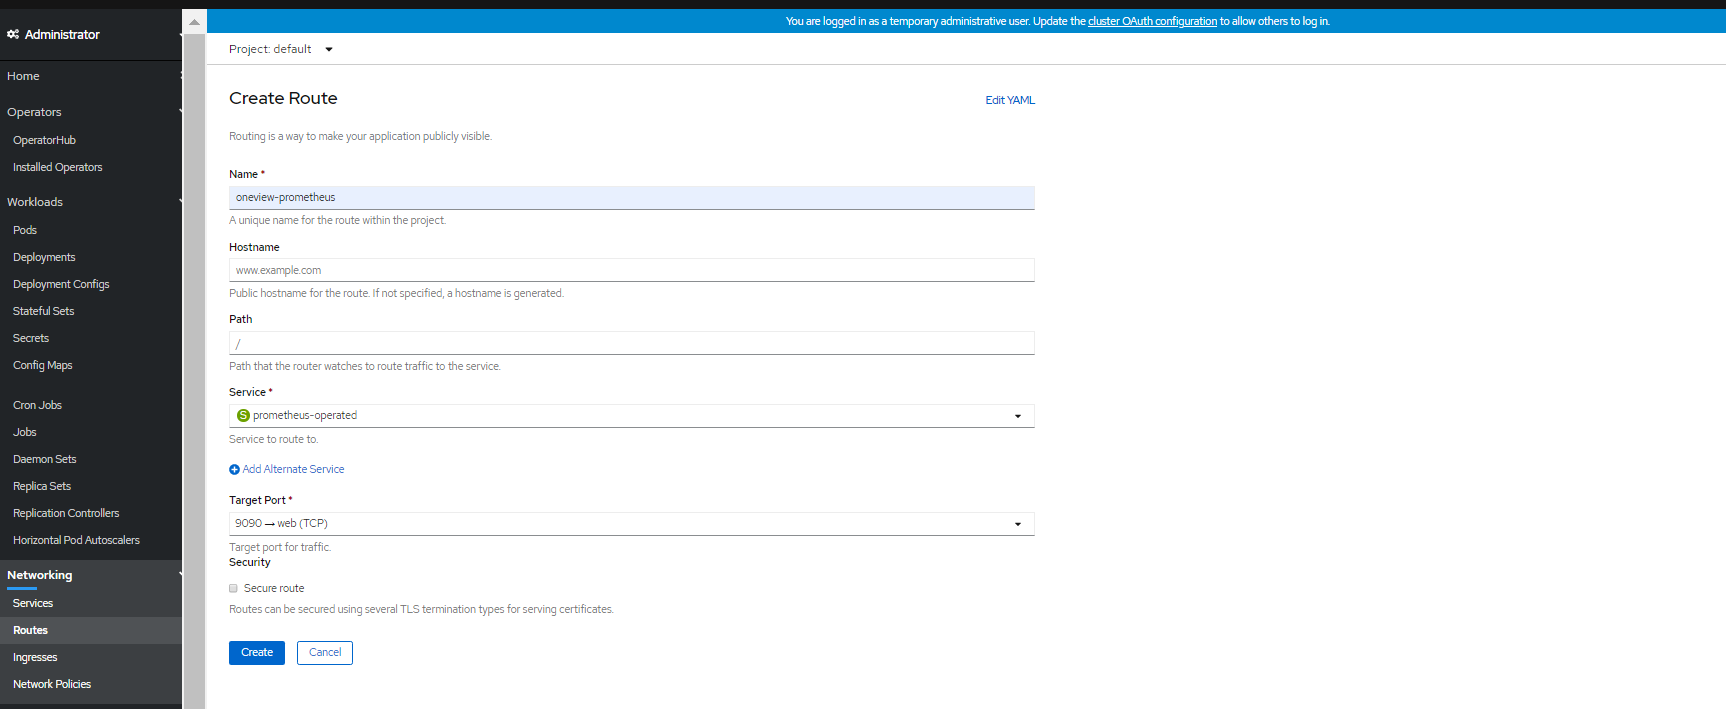
Figure 33. Create Prometheus operator URL
On the Routes page, navigate to Location. Click Prometheus URL to open Prometheus dashboard. Figure 34 shows the output for Click Prometheus URL to open Prometheus dashboard.
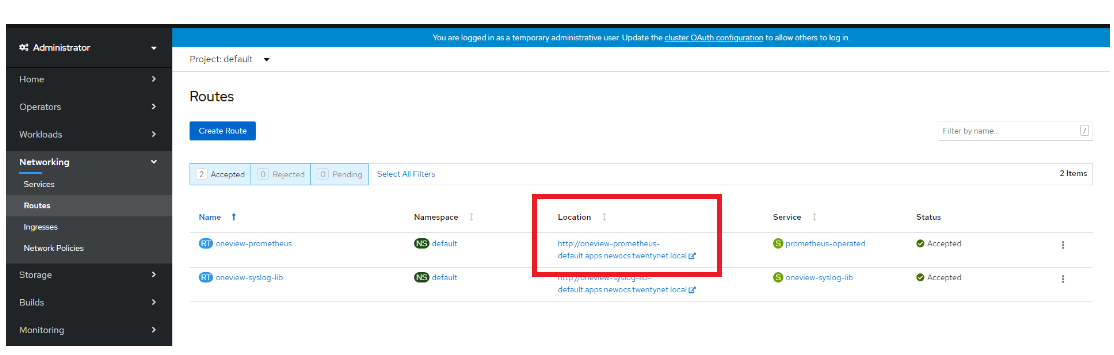
Figure 34. Link for Prometheus operator URL dashboard
Figure 35 shows the output of window Prometheus operator dashboard .
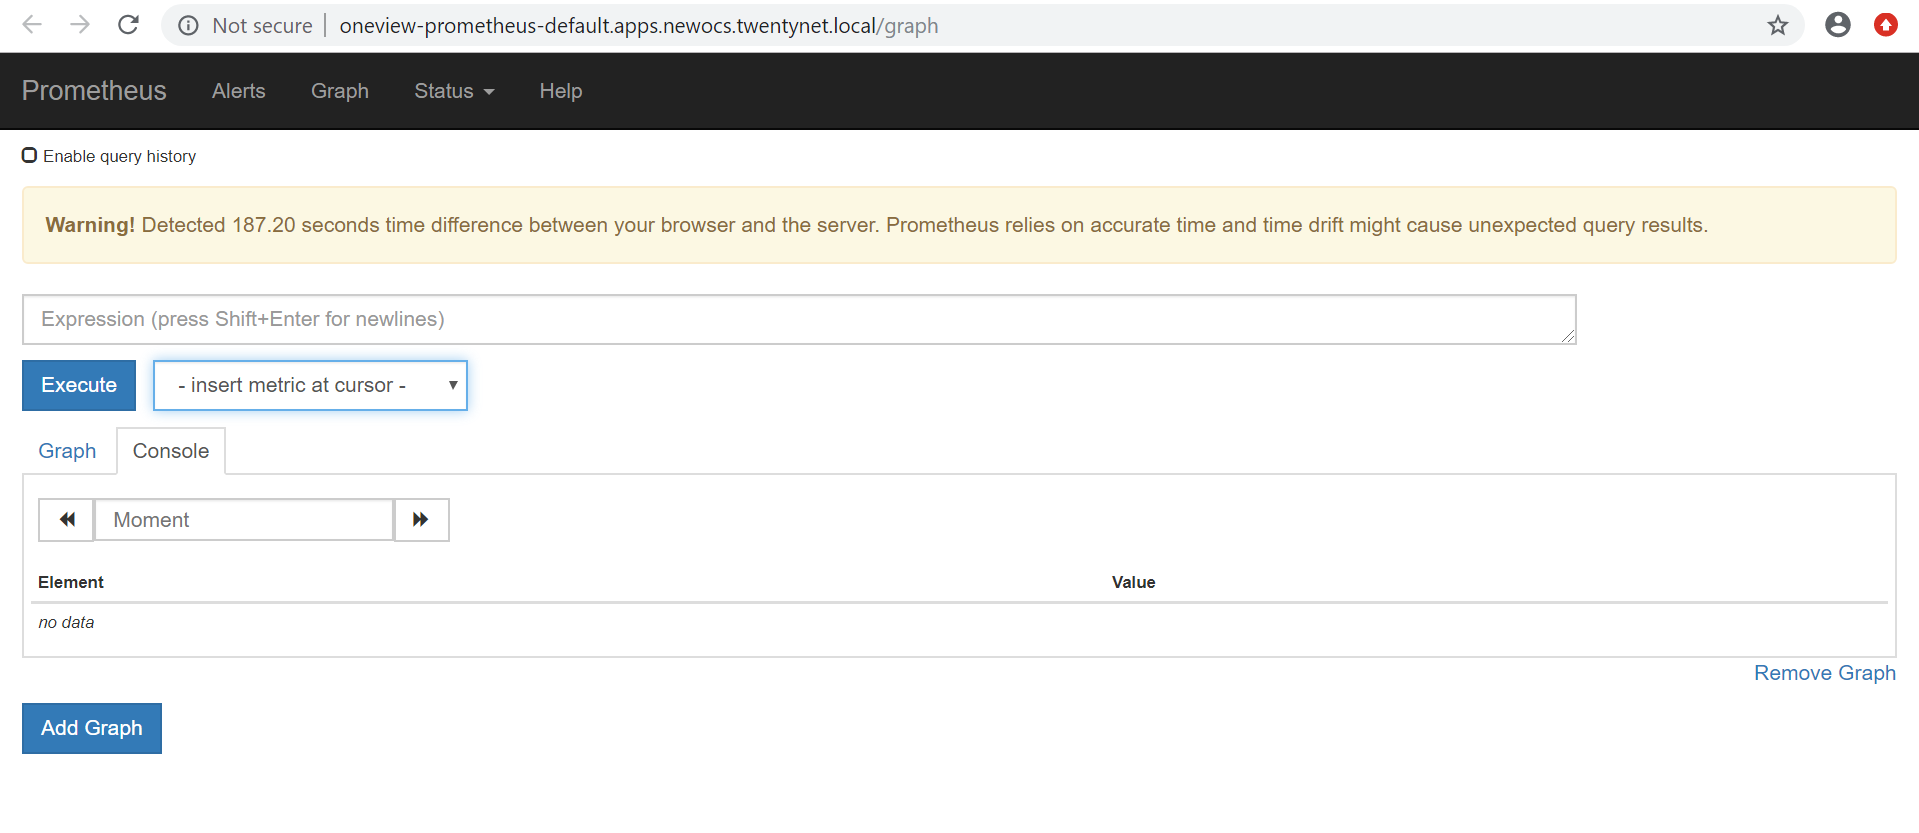
Figure 35. Prometheus operator dashboard status
Warning
Time difference between the browser and the server is expressed in seconds. Prometheus relies on accurate time and time drift might cause unexpected query results.
- On the Prometheus dashboard, select ov_all_critical_messages from the drop-down list and click Execute. Figure 36 shows the output of checking HP OV(OneView) events in Prometheus operator dashboard.

Figure 36. HPE OneView events in Prometheus operator dashboard
- Click the Graph option to see the graphical view. Figure 37 shows the output of HPE OneView events in graphical view on Prometheus operator dashboard.
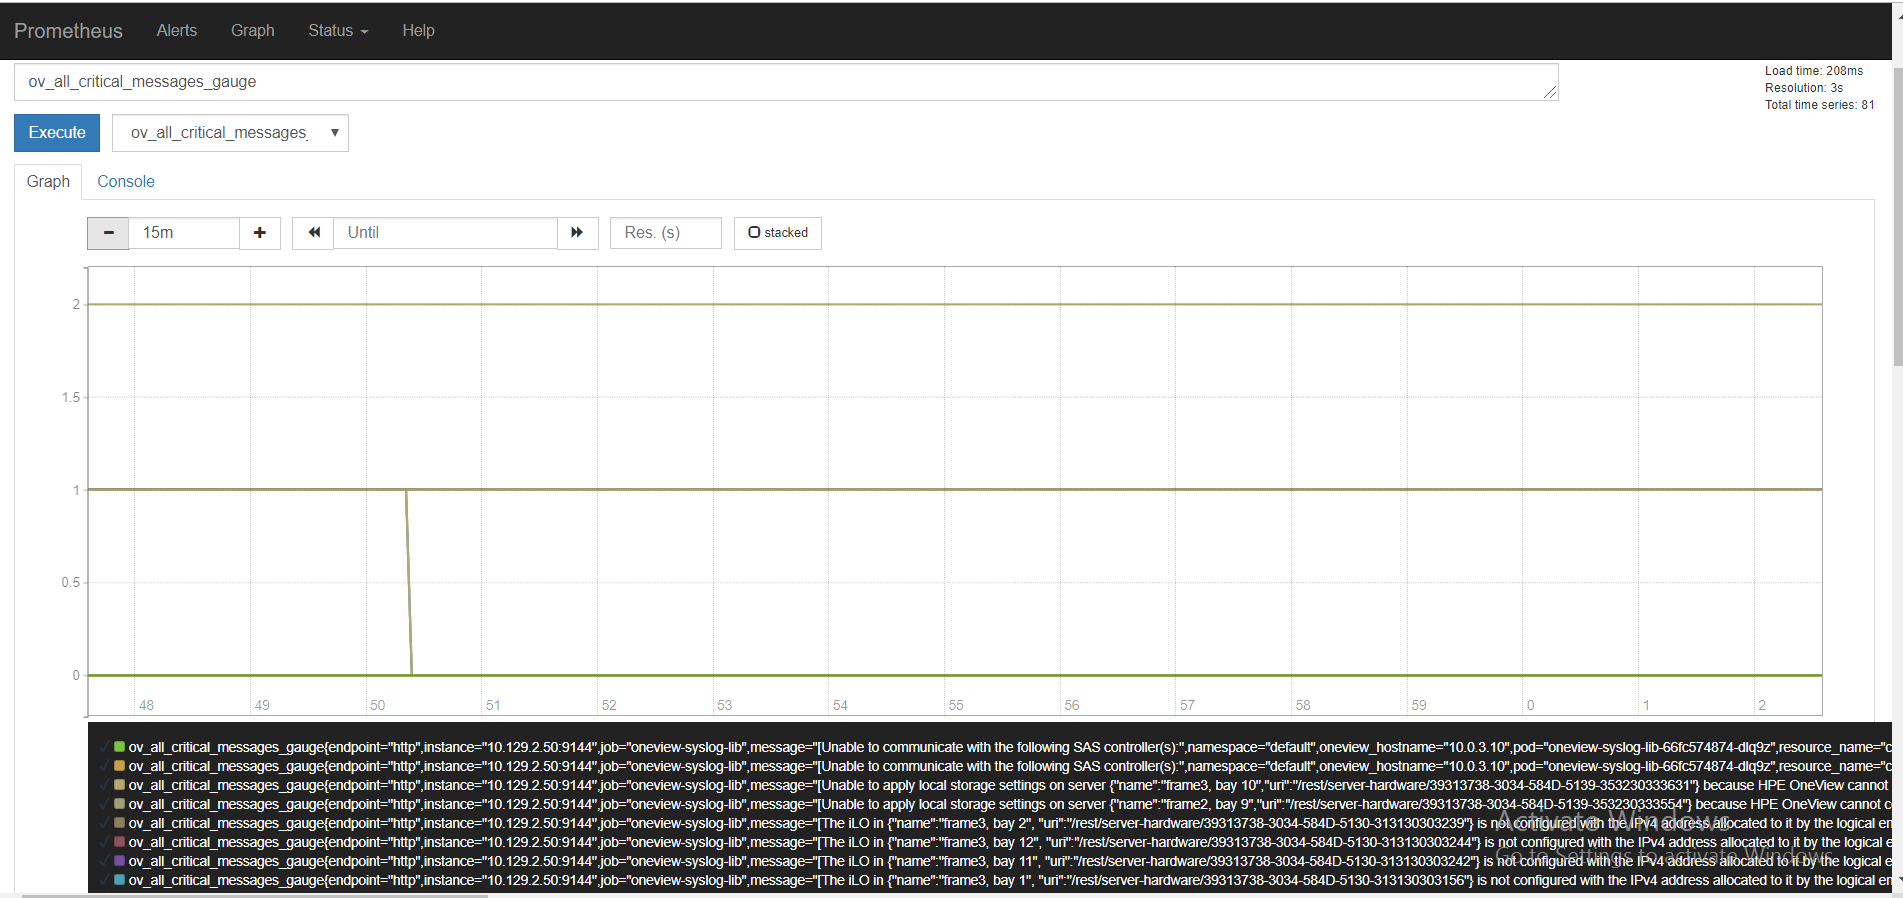
Figure 37. HPE OneView events in graphical view on Prometheus operator dashboard