# OpenShift operators
Prerequisites
- Red Hat OpenShift Container Platform 4.4.x console
- Availability of any Storage Class (Nimble, 3PAR, Local Storage, and OCS) in OpenShift Container Platform
- Python 3.6.x should be available on installer VM
- 'Ansible' and 'Requests' python modules.
# Introduction
Operators are pieces of software that ease the operational complexity of running other pieces of software. They act like an extension of the software vendor’s engineering team, watching over a Kubernetes environment (such as OpenShift Container Platform) and using the current state to make decisions in real-time. Any container implementation requires certain operators that need to be enabled for use by the end user. This requirement is satisfied by using a combination of Python and Shell scripts and their execution for automating the installation of these operators.
Hewlett Packard Enterprise has deployed the following operators in an automated fashion:
Kiali Operator
Jaeger Operator
Red Hat OpenShift Service Mesh
Prometheus Operator
Grafana Operator
Elasticsearch Operator
Fluentd Operator (Cluster Logging)
Kibana Operator (Cluster Logging)
# Scripts for configuring the operators
Note
BASE_DIR is the directory path for all automated scripts and the path is /opt/hpe/solutions/ocp/hpe-solutions-openshift/synergy/scalable
This section provides details on the scripts developed to automate the installation of operators on the OpenShift Container Platform cluster. The scripts to install operators can be found in the installer VM at BASE_DIR/platform/operator_install.
deploy_validate_operators.py : Main python script which installs and validates the required operators.
config.py : Python script to convert user input values into program variables for usage by the deploy_validate_operators.py script.
userinput.json : Input json file filled by the installation user.
config_secrets.json : Encrypted input json file filled by the installer user.
# Installing the operators on the OpenShift Container Platform cluster
Login to the Ansible Installer virtual machine as a non-root user and browse to Python virtual environment.
Update the config_secrets.json file found at $BASE_DIR/platform/operator_install with the following setup configuration details:
# OPENSHIFT_USERNAME: <OpenShift Container Platform cluster username>
# OPENSHIFT_PASSWORD: <OpenShift Container Platform cluster password>
Update the userinput.json file found at $BASE_DIR/platform/operator_install with the following setup configuration details:
# OPENSHIFT_DOMAIN: <OpenShift Server sub domain fqdn (api.domain.base_domain)>
# OPENSHIFT_PORT: <OpenShift Server port number (OpenShift Container Platform runs on port 6443 by default)>
# OPENSHIFT_OPERATOR_LIST: ["jaeger-product", "kiali-ossm", "servicemeshoperator","grafana-operator","prometheus",elasticsearch-operator","cluster-logging"]
# OPERATOR_CHANNEL_LIST: ["stable", "stable", "1.0","alpha","beta","4.4","4.4"]
# OPERATOR_SOURCE_LIST: ["redhat-operators","redhat-operators","redhat-operators","community-operators","community-operators","redhat-operators","redhat-operators"]
# OPERATOR_INSTALL_PLAN: ["Automatic", "Automatic", "Automatic","Automatic","Automatic","Automatic","Automatic"]
# OPENSHIFT_PROJECT_NAME: <OpenShift Project Name>
# OPENSHIFT_CLIENT_PATH: < OpenShift OC client tool path (leave it empty if a path has been set)>
# OPENSHIFT_STORAGE_CLASS_NAME: < provide the storage class name to be used by the cluster logging operator >
Note
The operator list, channel details, operator source, and install plans can be used if the user wants to install additional operators. For the default installation of the required operators, the user should not modify these fields.
Execute the following command to install the operators discussed in the Introduction section of this document.
$ cd $BASE_DIR/platform/operator_install

$ python –W ignore deploy_validate_operators.py
The output of the command is as follows:
$ python -W ignore deploy_validate_operators.py
    Enter key for encrypted variables:
    Logging into your OpenShift Cluster
    Successfully logged into the OpenShift Cluster
    Token is generated
    Creating Operators...
    Creating Operator jaeger-product
    Creating Operator kiali-ossm
    Creating Operator servicemeshoperator
    Creating Operator grafana-operator
    Creating Operator prometheus
    Creating Operator elasticsearch-operator
    Creating Operator cluster-logging
    Validating Operators...
    The Required Operators have been Created

    Deploying Service Mesh Control Plane..
    Created Service Mesh Control Plane
    Validating Control Plane Creation...
    Control Plane is present and validated!

    Deploying Service Mesh Member Roll...
    Created Service Mesh Member Roll
    Validating Member Roll Creation...
    Member roll is present and validated!

    Deploying Logging Cluster...
    Created Logging instance
    Validating Cluster Logging Instance Creation...
    Cluster Logging Instance is present and validated!

    AUTOMATION IS COMPLETE...
    $
# Validation of the operator installation
The required operators will be created after the execution of the script and they will be reflected in the OpenShift console. This section outlines the steps to verify the operators created through script and are reflected in the GUI:
Login to the OpenShift Console as the user with administrative privileges.
Navigate to Operators -> Installed Operators -> select your project name.
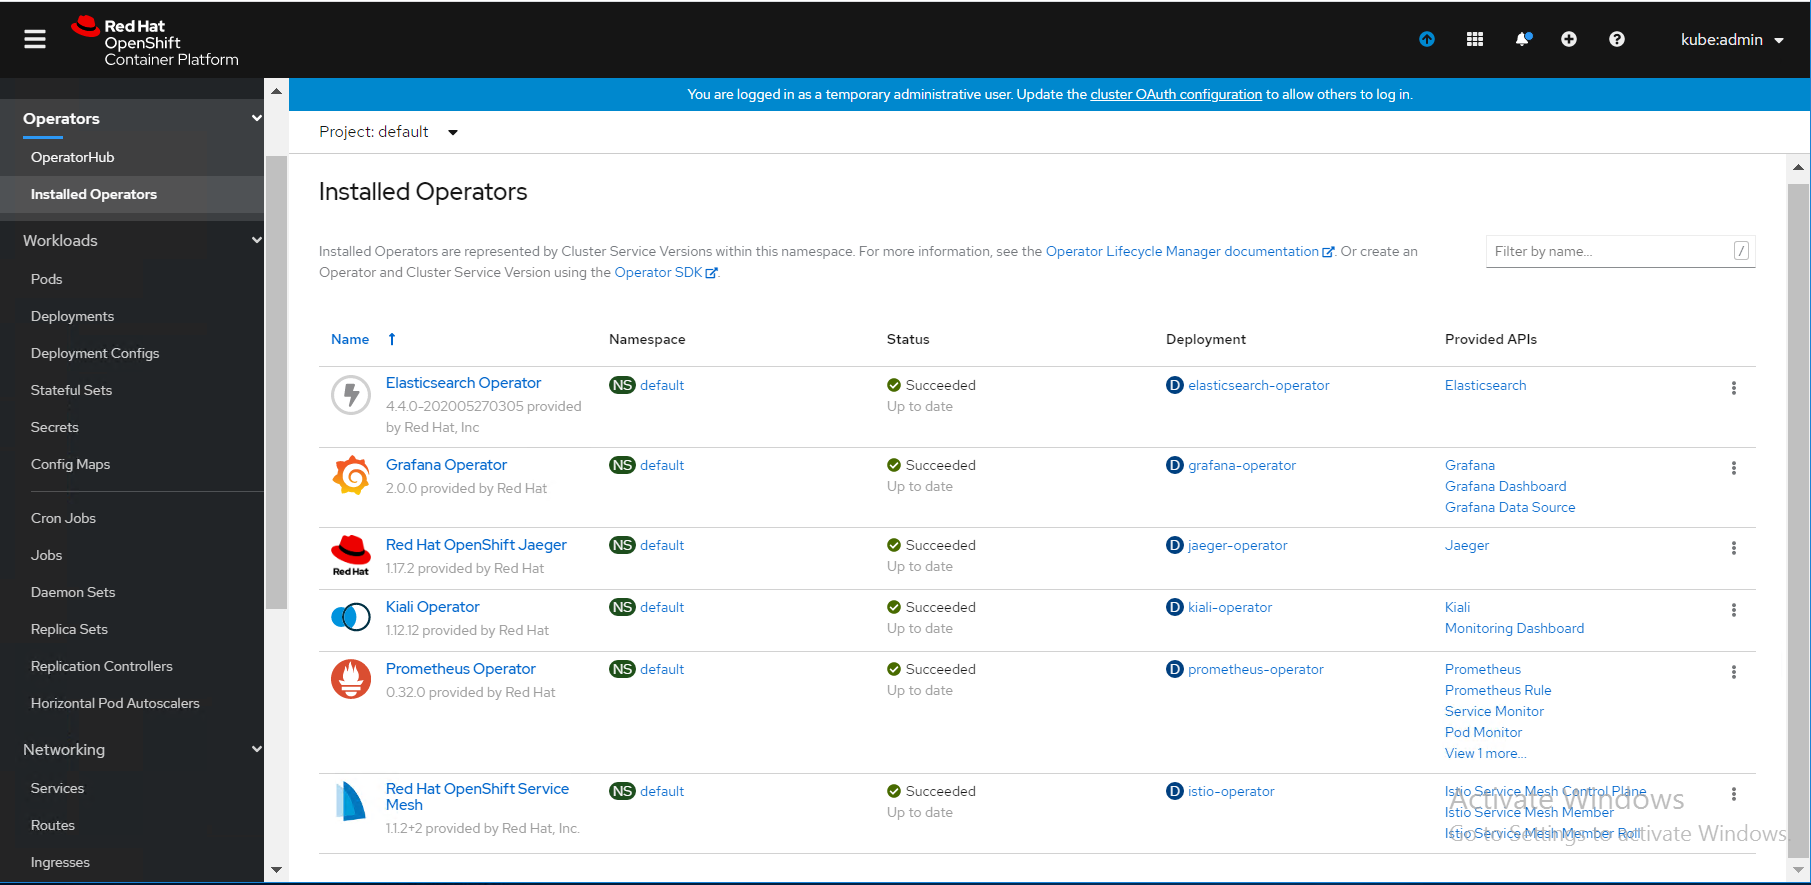
The operators will be displayed in the OpenShift web console as shown in Figure 19.

Figure 19. Installed Operators in the selected project.
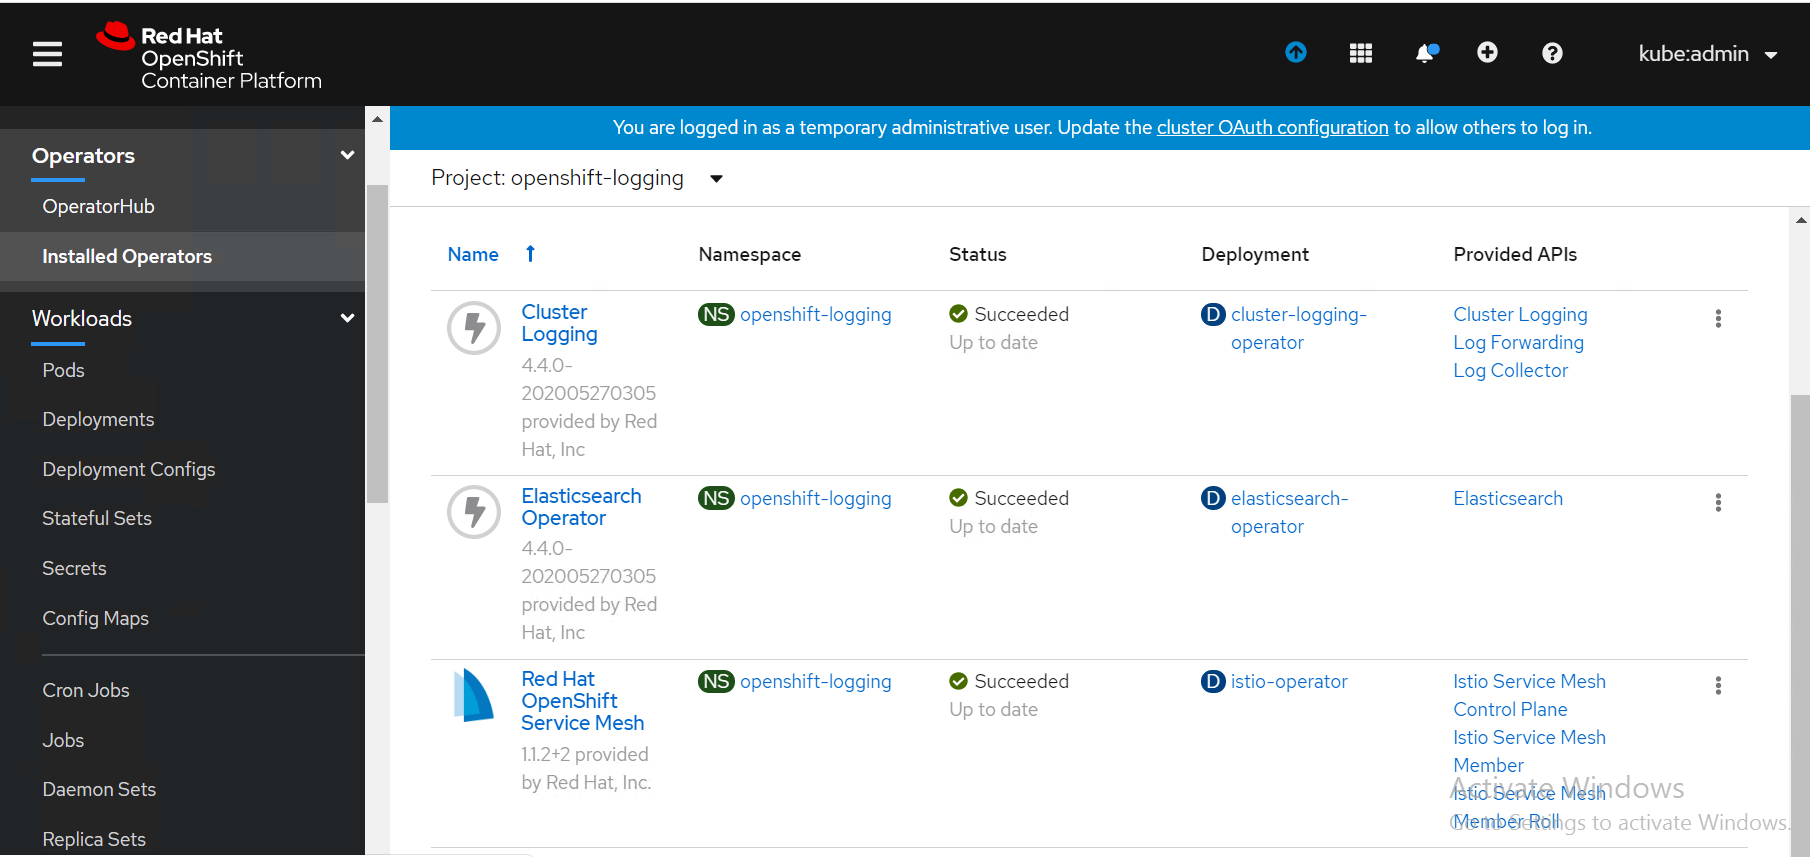
- To view the cluster-logging operator and its instance, navigate to "openshift-logging" project name. Figure 20 shows the cluster-logging operator in the OpenShift web console.

Figure 20. Cluster-logging operator in OpenShift web console
Steps to verify the installation of cluster-logging and EFK pods:
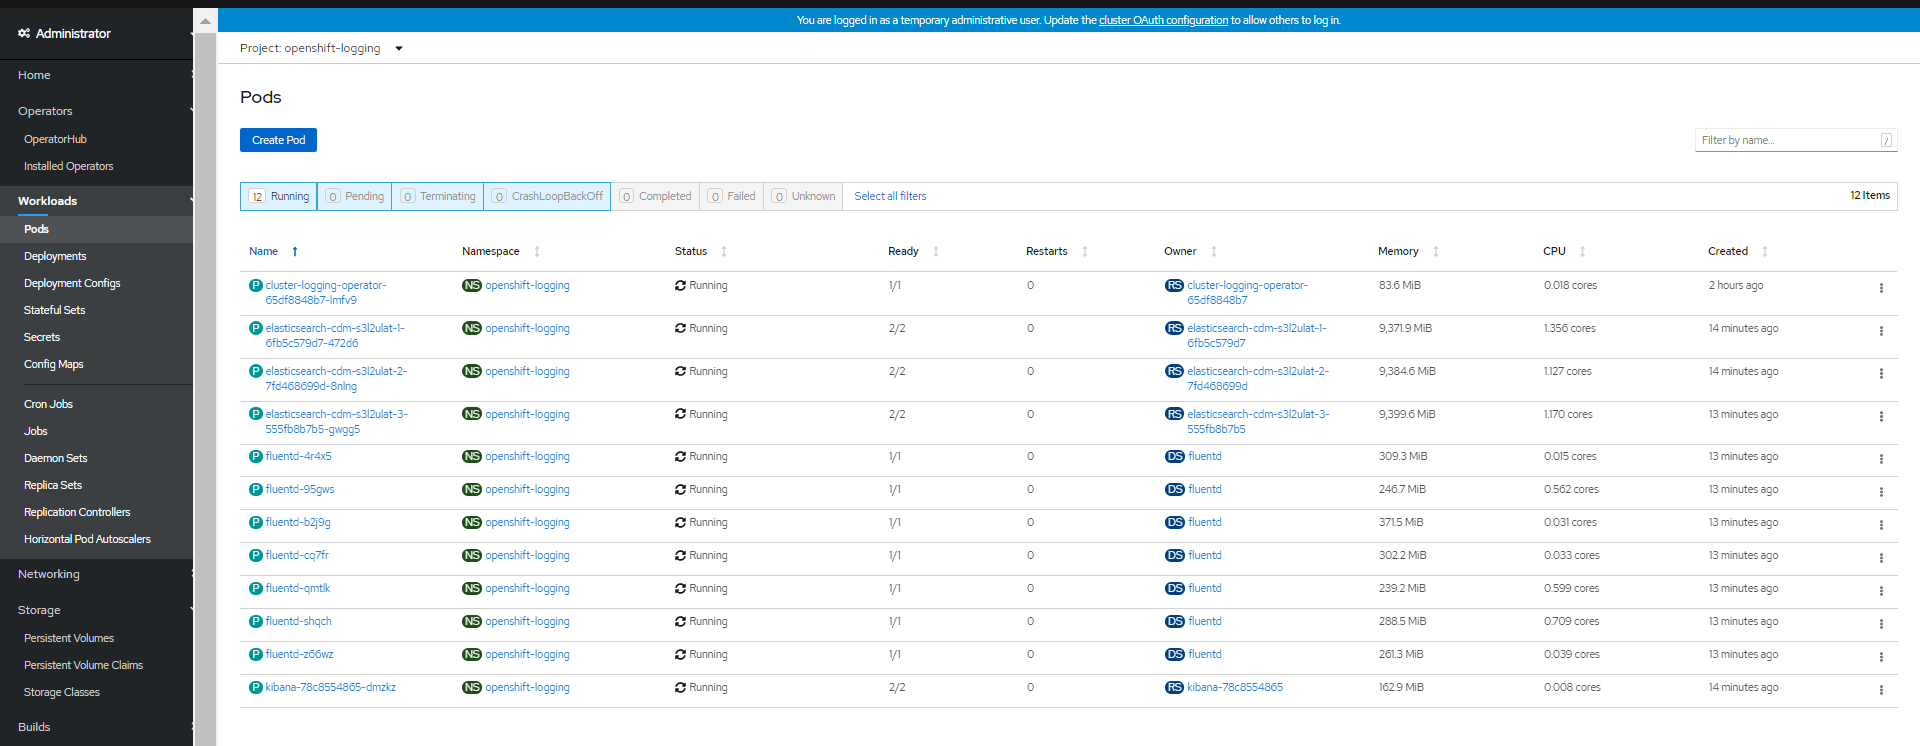
Navigate to the Workloads → Pods page ( inside the openshift-logging project).
You should see several pods for cluster logging: Elasticsearch, Fluentd, and Kibana as shown in Figure 21.

Figure 21. Cluster-logging and EFK pods in the openshift-logging project.
# Launch Kibana dashboard from OpenShift cluster
Switch to Networking. Select Routes option , navigate to Location. Click Kibana URL to open a new tab in the browser as shown in Figure 22.

Figure 22. Launch Kibana dashboard
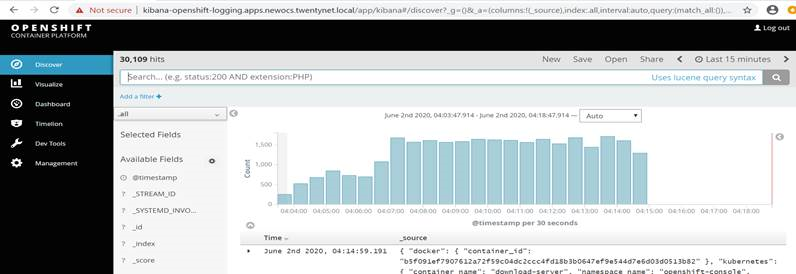
Kibana dashboard appears as shown in Figure 23.

Figure 23. View of Kibana dashboard