# Kibana Setup on HPECP
# Introduction
Kibana is a free and open frontend application that sits on top of the Elastic Stack. It provides visualization capabilities where users can create bar, line and scatter plots, or pie charts and maps on top of large volumes of data
Pre-requisites
- SSH access to HPECP controller node
# Flow Diagram
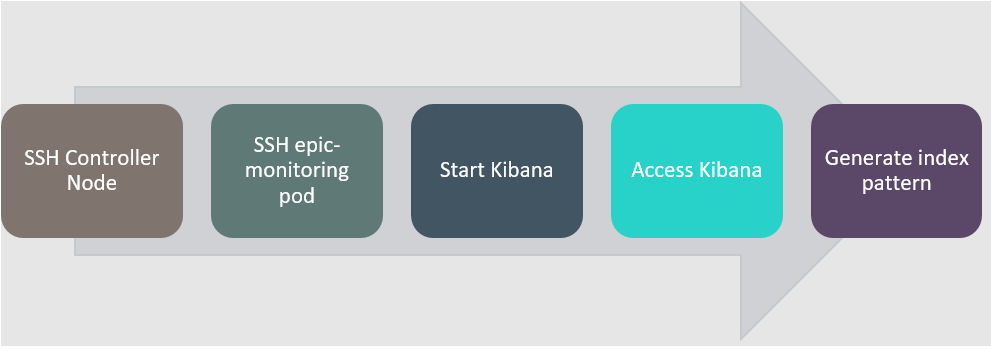
Figure 85: Flow diagram of kibana on HPECP environment
# Kibana Setup
Kibana should be running by default inside epic-monitoring container under controller node. If Kibana is not running perform the following steps
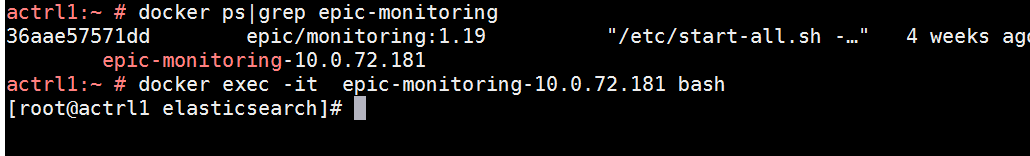
SSH to the controller node
Search for epic-monitoring container and ssh to the container
Change the permission of /etc/kibana/kibana.yml to 644

Start the kibana service and verify the service is running fine

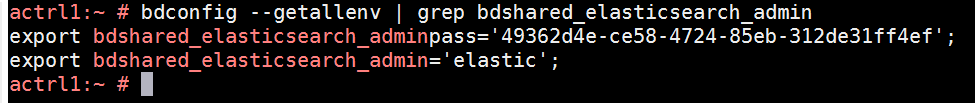
Obtain the Kibana admin credentials
Exit from the epic-monitoring container and run below commands in controller node. Output of the command provides the credentials to login to Kibana
Access Kibana WEBGUI using controller_ip:5610
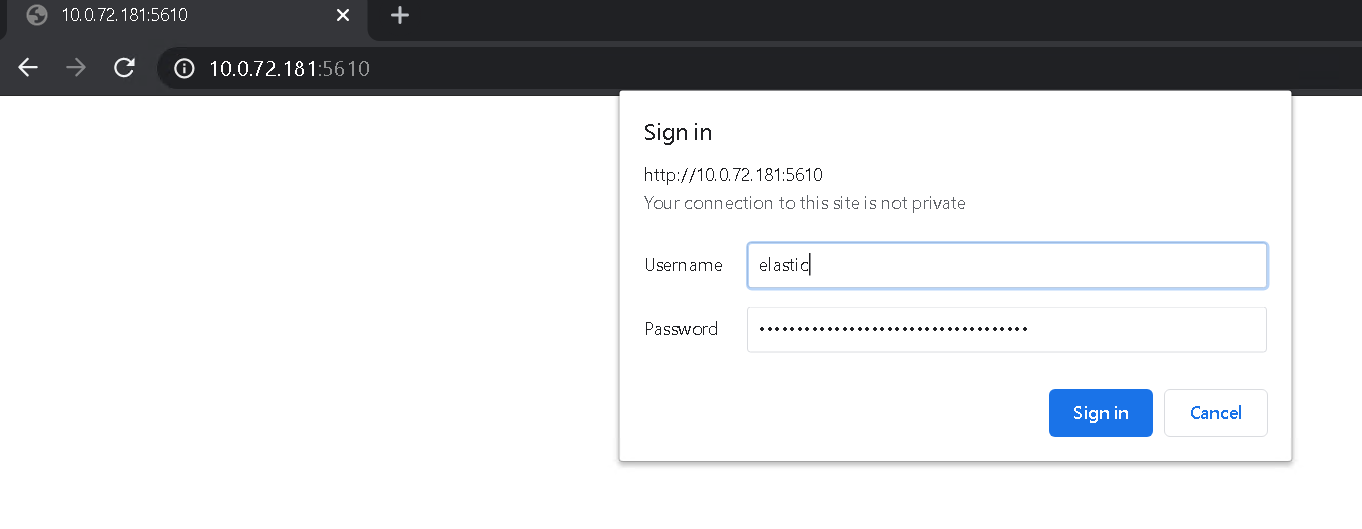
Provide the credentials obtained from the step 5
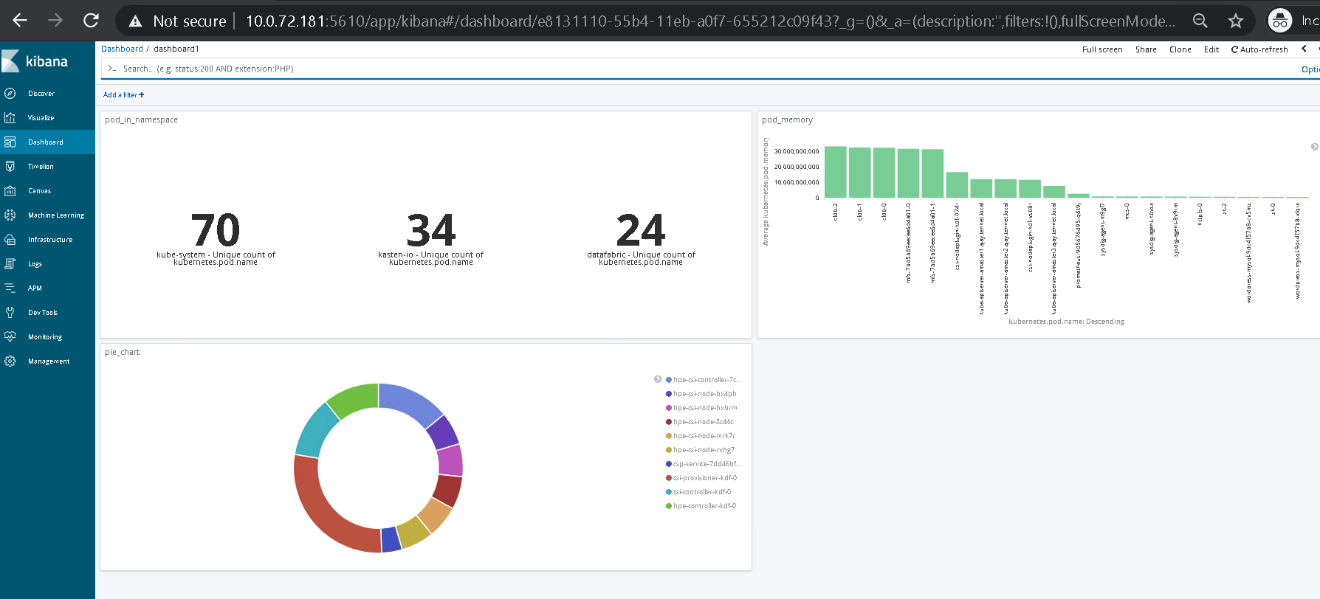
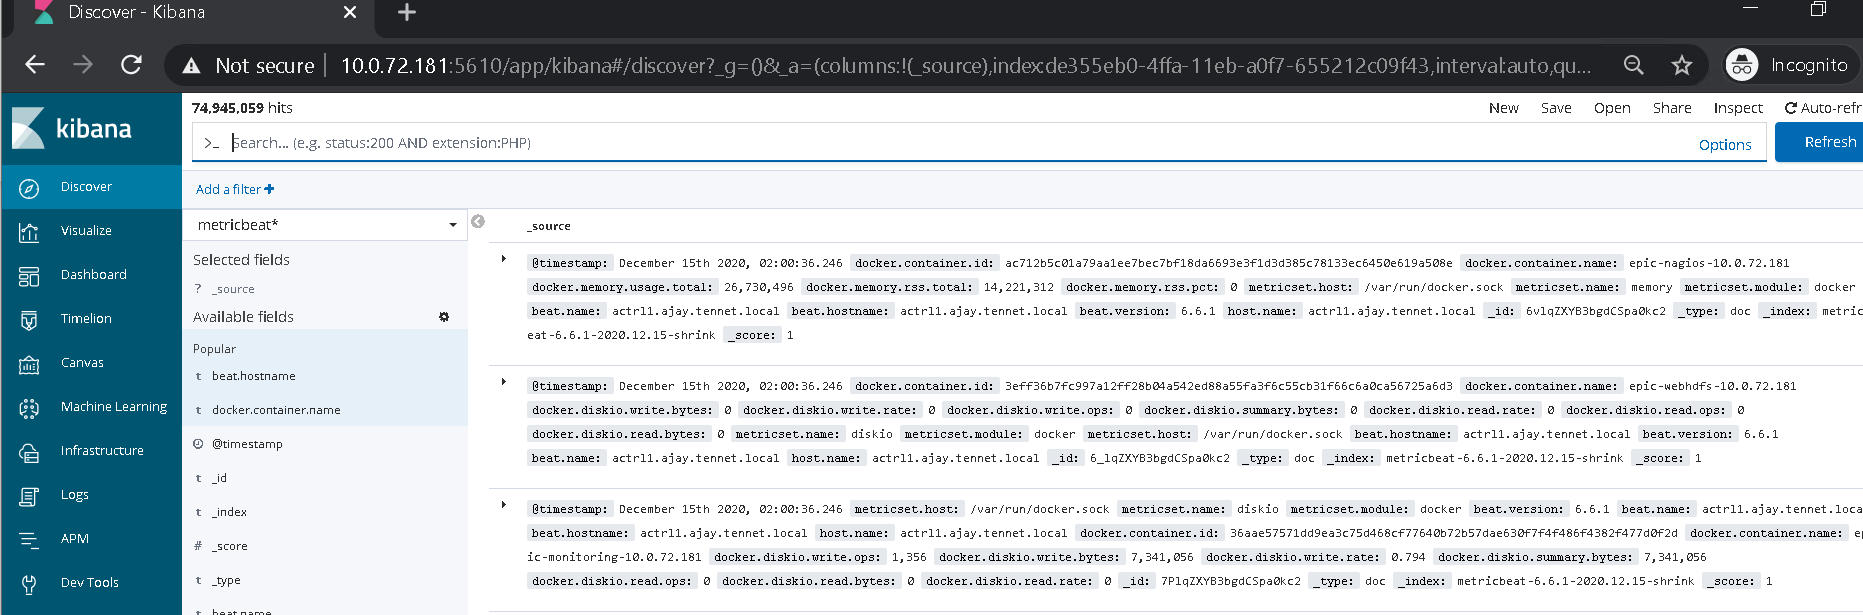
User can view the Kibana page as below
Create index patterns
Go to Management section, click on Index patterns and Click Create Index pattern
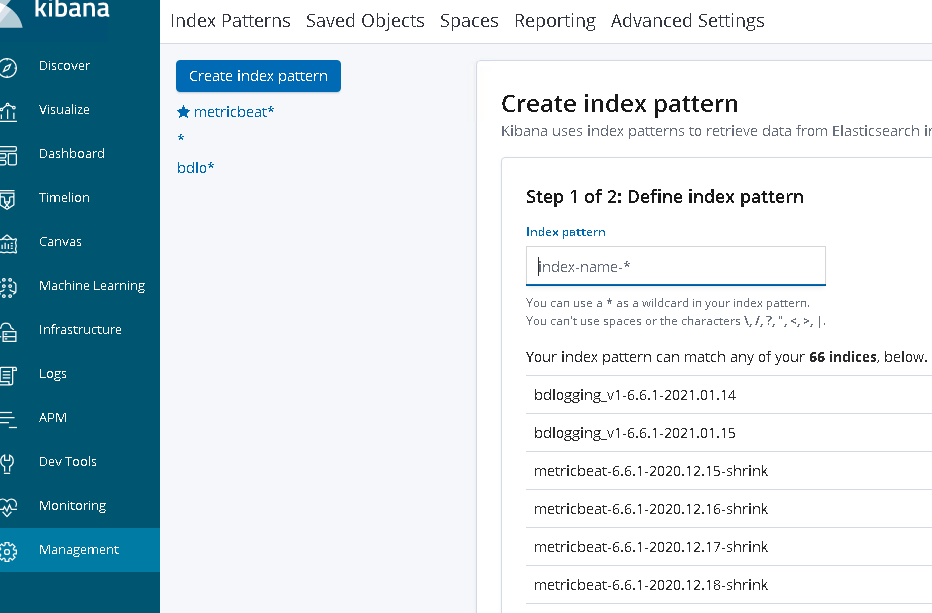
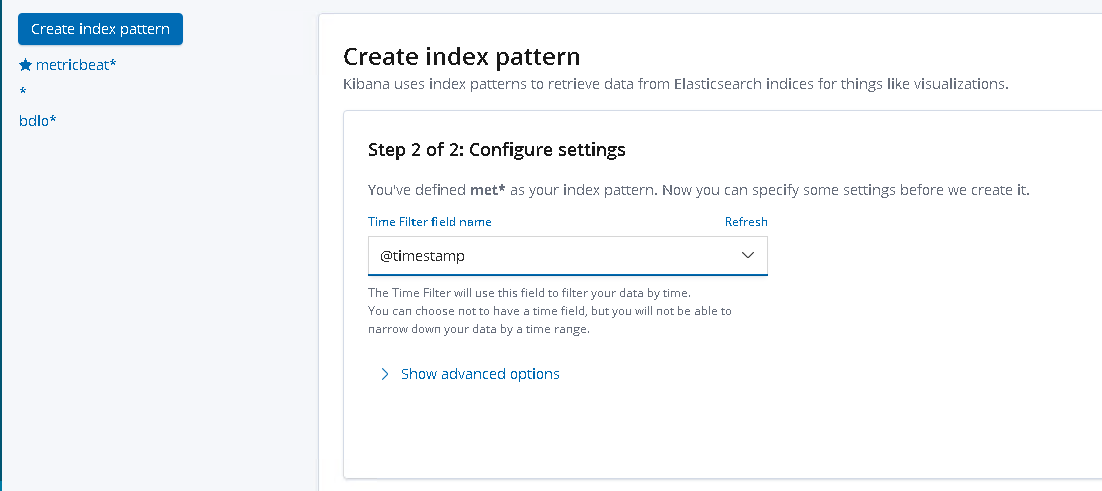
Type any pattern or choose Wildcard "*" and in next step choose timestamp
Once index pattern is created, click on Discover and choose the required index pattern
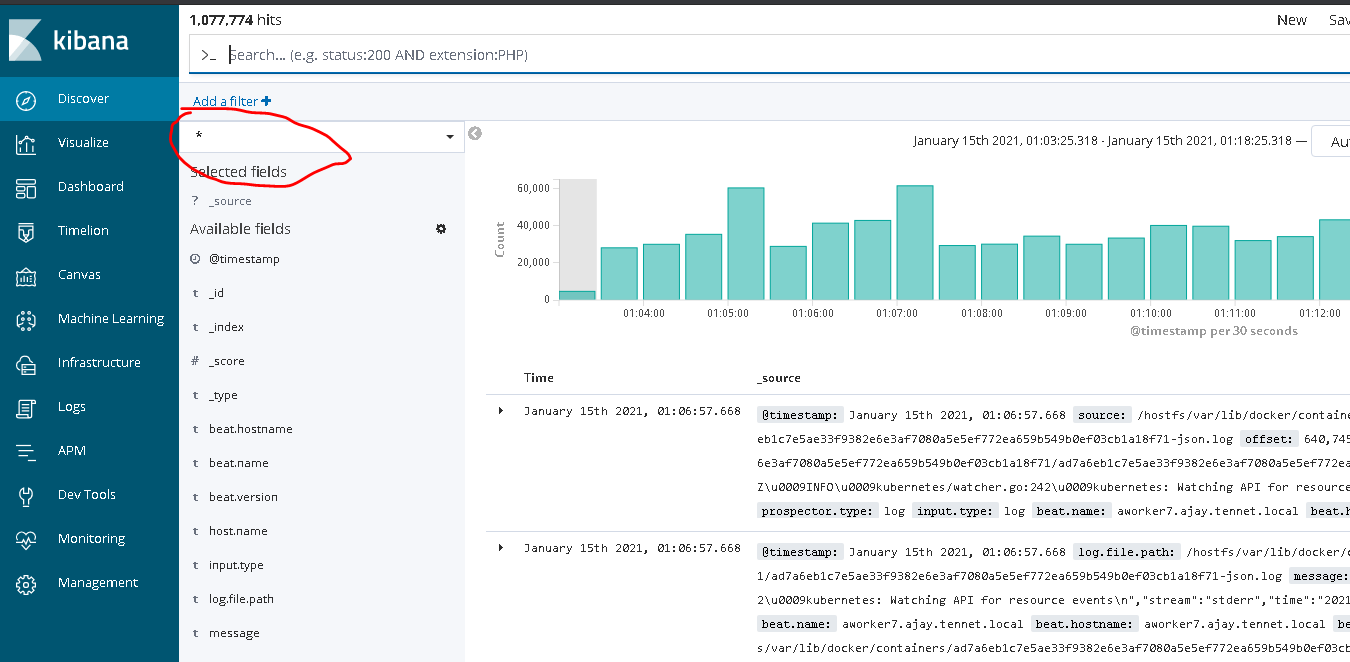
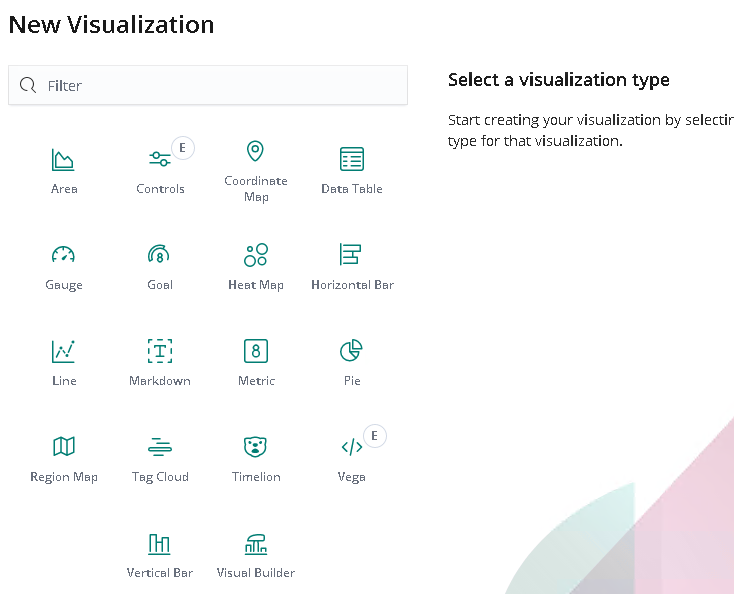
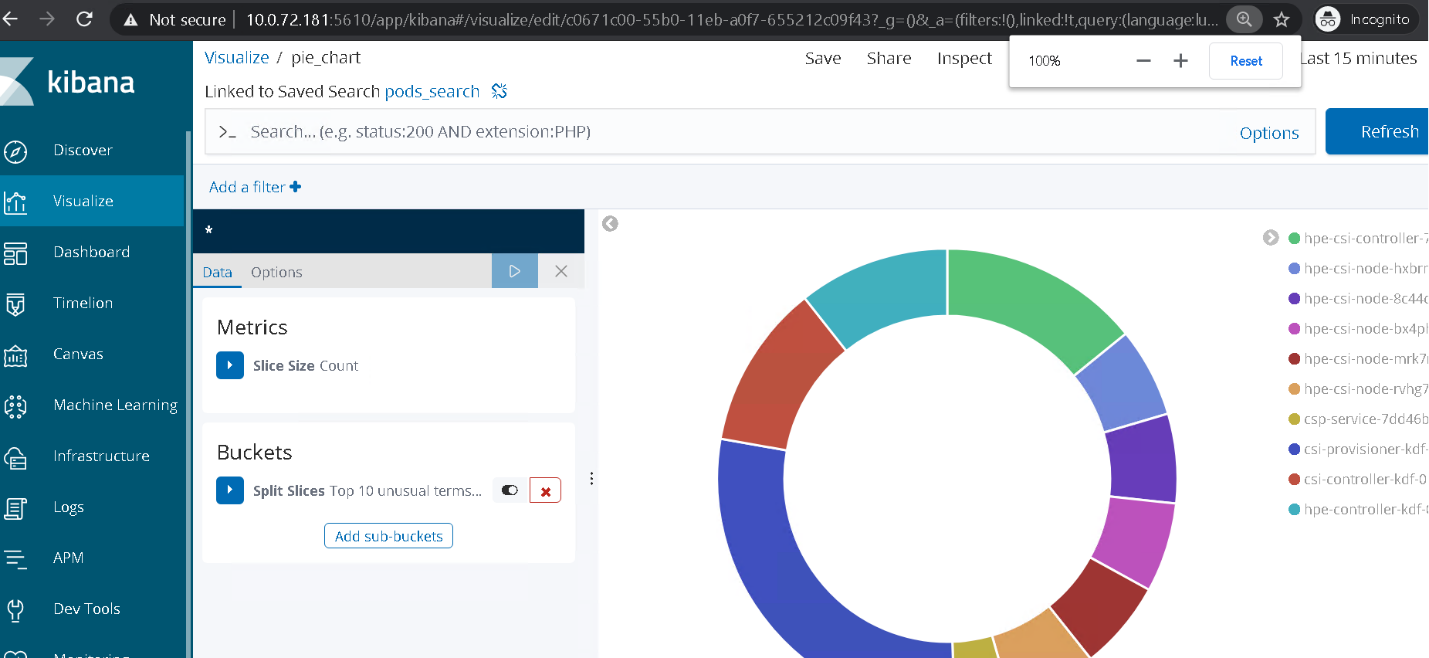
Select Visualize and use various option to generate graph or visualize the data.
Once visualization is created, save the chart
Now all the visualization graph can be added to the dashboard