# Physical worker node labeling in Red Hat OpenShift cluster
# Description
This section describes the scripts to automate the process of retrieving the hardware properties from physical worker nodes of the Red Hat OpenShift cluster and using the Red Hat OpenShift Node Labeling capability to label the physical worker node with the retrieved properties. These node labels along with Red Hat OpenShift node selector capability can be used by the user for defining the pod deployment configuration in order to ensure pod is running on the physical node with desired hardware properties.
Nodes can be labelled for the following properties:
- Overall Health Status of the node - If current status health status of following components "BIOS, Fans, Temperature Sensors, Battery, Processor, Memory, Network and Storage" of the HPE Synergy compute is ok, physical node health status is considered "Ok" else "Degraded"
- Overall Security Status of the node - If the current status of the following BIOS security configuration (which are important for the compute security) is as listed "secure boot status: enabled, asset tag: locked, UEFI Shell Script Verification: enabled, UEFI Shell Startup: disabled, Processor AES: enabled" then the overall security status of the physical node is considered "Ok" else "degraded".
- Custom labeling - User defined labels (key, value) is assigned to desired physical worker node.
PREREQUISITES
Ansible engine with Ansible 2.9.x and Python 3.6.x
Red Hat OpenShift 4.x is up and running.
The RedHat OpenShift cluster must have physical worker node to use the "Node labeling" functionality.
The playbook under this repository needs to be run from Ansible Installer Machine with the Python virtual environment as non-root user.
NOTE
Refer to Non-root user accesssection of this deployment guide to know more about the non-root user details.
Python module "proliantutils" is installed on the OpenShift Installer Machine.
"proliantutils" is a set of utility libraries for interfacing and managing various components (like iLO) for HPE ProLiant Servers.
- Use the following command to install proliantutils.
> pip install ansible==2.9.0- Verify the version of proliantutils.
> pip freeze | grep proliantutils- Output
proliantutils==2.9.2Install the "sushy" python library. In case "sushy" module is already installed, please ensure its version is 3.0.0.
- Use the following command to install sushy module.
> pip install sushy==3.0.0- Verify the version of proliantutils.
> pip freeze | grep sushy- Output:
sushy==3.0.0
# Software requirements
| Software | Version |
|---|---|
| HPE OneView | 5 |
# Input files
- Playbook for RedHat OpenShift Container Platform Physical Worker Node labeling are available under $BASE_DIR/platform/physical-physical-workerlabeling/
NOTE
BASE_DIR is defined and set in installer machine section in deployment guide.
It is mandatory to update all the input files (hosts, secrets.yml, sysdig-agent-configmap.yaml) with appropriate values before running the playbook available in this repository.
Input file name: hosts.json
- This file is an inventory of host details.
- This file contains sensitive information like iLO IP and credentials, Worker IP and labels. So, data inside this file is encrypted.
- To edit this vault file, use the following command and
provide the default "ansible vault" password.
> ansible-vault edit hosts.json - For each of the physical worker node that is part of RedHat
OpenShift cluster, the user needs to provide the following
information:
"host_fqdn": "replace_with_physical_worker_node1_fqdn",
"ilo_ip": "replace_with_ilo_ip_of_physical_worker_node1",
"username": "replace_with_ilo_username",
"password": "replace_with_ilo_password",
"custom_label_required": "replace_with_No_or_Yes",
"label_name": "replace_with_desired_label_key",
"label_val": "replace_with_desired_label_value"
NOTE
Information inside hosts.json is available in a nested JSON format, which means user can add any number of physical worker node by creating the sections as "server 1, server 2, server 3, ...server N" and can also add any number of "custom labels" as "label 1, label 2, label 3 to label N". Refer to "hosts.json" to understand this nested JSON structure. "N" represent the Nth number server.
Input file name: config.json
- Provide the path information about "kubeconfig" and "oc"
command.
- kubeconfig_path: The value of this key is the path of kubeconfig and this path is used by "oc" command at runtime.
- oc_command_path: The value of this key is the oc command path and this path is used to run the "oc" command.
"kubeconfig_path": "replace_with_path_of_ocp_kubeconfig",
"oc_command_path": "replace_with_path_of_ocp_installation_dir"
- Provide the path information about "kubeconfig" and "oc"
command.
# Steps to run the Node Labeling automation scripts
- Execute the following commands from the Ansible installer VM in the python virtual environment as a non-root user.
> cd $BASE_DIR/platform/physical-workerlabelling/
> python physical_node_labeling.py
NOTE
BASE_DIR is defined and set in installer machine section of deployment guide.
Next, the user will be prompted to enter the Ansible vault password or key. This credential is the default "Ansible vault" password.
$ Enter key for encrypted variables:
Output of above command will prompt following options
1: Get the physical worker node details that user wishes to configure. 2: Get current health status of the physical worker node 3: Get security parameters of the physical worker node 4: Label the physical worker with health status 5: Label the physical worker with security status 6: Custom labels 7: Display current labels on the node 8: Quit $Enter the choice number: ```Next, the user will be prompted to enter the Ansible vault password or key. This credential is the default "Ansible vault" password.
> Enter key for encrypted variables:If user selects option 1, then they will see all the information available within the hosts.json file
If user selects option 2, then aggregated health status of the physical worker nodes will be shown to the user as:
{'worker1.newocs.twentynet.local': 'OK', 'worker2.newocs.twentynet.local': 'OK'}If user selects option 3, then this playbook will show the aggregated security status of the physical worker node as:
{'worker1.newocs.twentynet.local': 'OK', 'worker2.newocs.twentynet.local': 'Degraded'}If user selects option 4, then the physical worker node will be labelled with its respective "aggregated health status" as given by option 2:
worker1.newocs.twentynet.local
NAME                             STATUS   ROLES    AGE   VERSION   LABELS
worker1.newocs.twentynet.local   Ready    worker   64d   v1.17.1   app=sysdig-agent,beta.kubernetes.io/arch=amd64,betkubernetes.io/os=linux,health=OK,kubernetes.io/arch=amd64,kubernetes.io/hostname=worker1.newocs.twentynet.locakubernetes.io/os=linux,node-role.kubernetes.io/worker=,node.openshift.io/os_id=rhcos
Verified - Label  health=OK is added to the node worker1.newocs.twentynet.local

worker2.newocs.twentynet.local
NAME                             STATUS   ROLES    AGE   VERSION   LABELS
worker2.newocs.twentynet.local   Ready    worker   64d   v1.17.1   app=sysdig-agent,beta.kubernetes.io/arch=amd64,betkubernetes.io/os=linux,health=OK,kubernetes.io/arch=amd64,kubernetes.io/hostname=worker2.newocs.twentynet.local,kuberneteio/os=linux,node-role.kubernetes.io/worker=,node.openshift.io/os_id=rhcoreplace_with_desired_label_key=replace_with_desired_label_value,security=Degraded
Verified - Label  health=OK is added to the node worker2.newocs.twentynet.local
If user selects option 5, then the physical worker node will be labelled with its respective "aggregated security status" as given by option 3:
NAME                             STATUS   ROLES    AGE   VERSION   LABELS
worker1.newocs.twentynet.local   Ready    worker   64d   v1.17.1   app=sysdig-agent,beta.kubernetes.io/arch=amd64,betakubernetes.io/os=linux,health=OK,kubernetes.io/arch=amd64,kubernetes.io/hostname=worker1.newocs.twentynet.local,kubernetesio/os=linux,node-role.kubernetes.io/worker=,node.openshift.io/os_id=rhcos,security=OK
Verified - Label  security=OK is added to the node worker1.newocs.twentynet.local

NAME                             STATUS   ROLES    AGE   VERSION   LABELS
worker2.newocs.twentynet.local   Ready    worker   64d   v1.17.1   app=sysdig-agent,beta.kubernetes.io/arch=amd64,betakubernetes.io/os=linux,health=OK,kubernetes.io/arch=amd64,kubernetes.io/hostname=worker2.newocs.twentynet.local,kubernetesio/os=linux,node-role.kubernetes.io/worker=,node.openshift.io/os_id=rhcosreplace_with_desired_label_key=replace_with_desired_label_value,security=Degraded
Verified - Label  security=Degraded is added to the node    worker2.newocs.twentynet.local
If user selects option 6, then the physical worker node will be labelled with the custom labels defined by user in the hosts.json file
NOTE
Custom labels will be applied on if user has selected "yes" or "no" in the json file for "custom_labels.
"If user selects option 7, then all the labels like security, health and custom labels along with default labels for each of the physical worker node will be shown.
If user selects option 8, Node labeling utility will exit.
# Overview
This document contains details of integration of HPE OneView with Prometheus operator on an existing Red Hat OpenShift Container Platform 4.6.
# HPE OneView Syslog library
The HPE OneView syslog generator repo helps in getting the alerts of HPE OneView alerts into a syslog. This is a python- based solution and uses HPE OneView APIs (REST and Message queues (SCMB)) to get the alerts and stats that converts into syslog. This syslog can be forwarded and consumed by log- readable monitoring solutions in Prometheus.
The library is a config driver, which allows user to filter the alerts based on severity and hardware resources.
Primarily, this library generates syslog for the following:
- Events generated from HPE OneView.
- Interconnect statistics (Port transmit/Receive/Speed/Model).
- Enclosure statistics (Temperature/Power).
- Server statistics (Temperature/Power/CPU frequency/CPU utilization).
- Remote support ticket information.
# Prerequisites for Syslog library
- Availability of the latest OpenShift Container Platform 4.6 cluster.
- Creation of host path "/mnt/oneview-syslog-lib" in all worker nodes.
- Install helm chat in OpenShift.
# Deploying HPE OneView Syslog pod on an existing pod with Red Hat OpenShift Container Platform
Download HPE OneView syslog packages from the following GitHub link. https://github.hpe.com/GSE/ov-prometheus-grafana/tree/master/oneview_syslog_lib (opens new window)
Use the following base64 command to generate an encoded password for HPE OneView.
> printf '%s' Password' | base64Update HPE OneView IP address, username and the encoded password in "/oneview_syslog_lib /config.json" and update the same details in "/oneview_syslog_lib/helm/log-generator/templates/config-map.yaml". This is done in accordance with the needs of the customer.
NOTE
Use step 4 and step 5 to create your own Docker images.
Build your own docker image using Docker file as shown and push images to your Docker Hub.
> cd to oneview_syslog_lib

> docker build -t <org>/oneview-syslog-lib:<tag>.

> cd to grok_exporter

> docker build -t <org name>/grok-exporter:<tag>.
Update both HPE OneView-syslog-lib and grok-exporter docker images on deployment.yaml in container section.
containers:

  - name: oneview-syslog-lib

    image: "John/oneview-syslog-lib:v10.0"

containers:

  - name: oneview-grok-exporter

    image: "John/grok-exporter:v2.0"
From OpenShift CLI, login to default project.
Create Persistent volume (PV) and Persistent Volume Claim (PVC) and verify whether both of them are bounded properly.
> oc create -f ov-syslog-pv.yaml

> oc create -f ov-syslog-pvc.yaml
Navigate to oneview_syslog_lib and run the following commands.
helm install helm/log-generator
Verify the status of HPE OneView-syslog-lib pod. Below snapshot shows the output after the helm install HPE OneView-syslog-lib pod status.

Figure 109. HPE OneView-syslog-lib pod output
# Installation of Prometheus operator on an existing Red Hat OpenShift Container Platform
Logon to the Red Hat OpenShift Container Platform web console.
Click Operators→ OperatorHub.
Search for Prometheus Operator from the list of operators and click it.
On the Prometheus Operator page, click install.
On the Create Operator Subscription page, select namespace as default in Installation Mode, Update Channel and Approval Strategy options. Below snapshot shows the output of Prometheus operator install process.
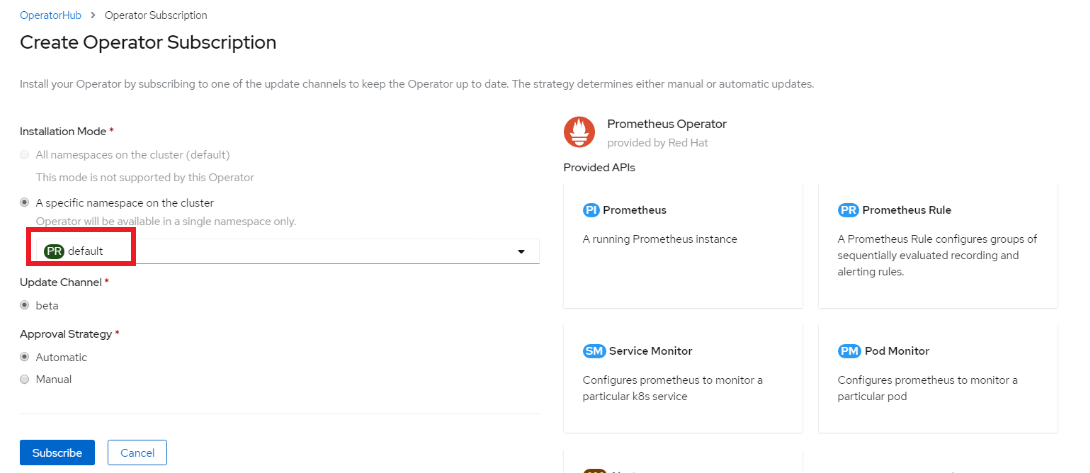 Figure 110 Prometheus Operator
install process
Figure 110 Prometheus Operator
install processClick Subscribe. The Installed Operators page is displayed with the status of the operator. Below snapshot shows the output of Prometheus operator status.
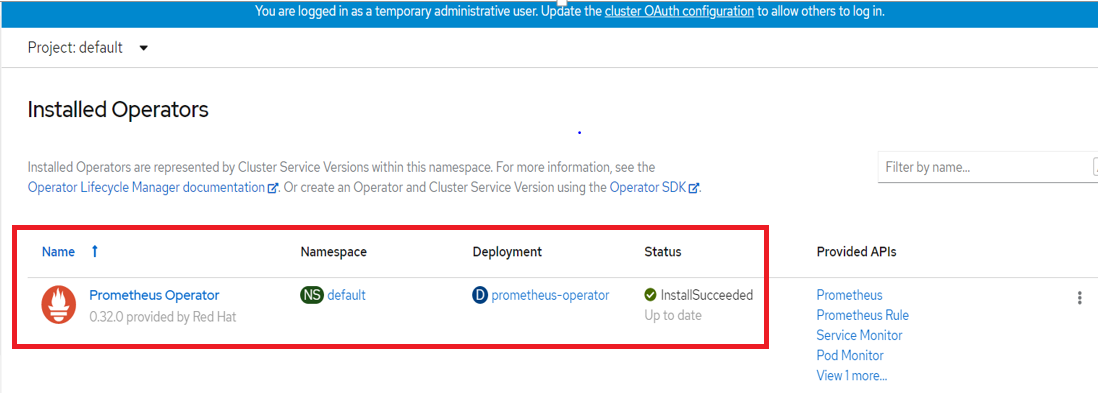
Figure 111. Prometheus Operator install status
# Integration of OneView syslog pod with Prometheus on an existing Red Hat OpenShift Container Platform
Click Operators → Installed Operators from the left pane of the OpenShift Web Console to view the installed operators.
On the Installed Operator page, select Prometheus Operator from the Project drop-down list to switch to the default project.
Click Prometheus Operator.
On the Prometheus Operator page, scroll right and go to Prometheus. Click Create Prometheus. Below snapshot shows the output for Prometheus service.
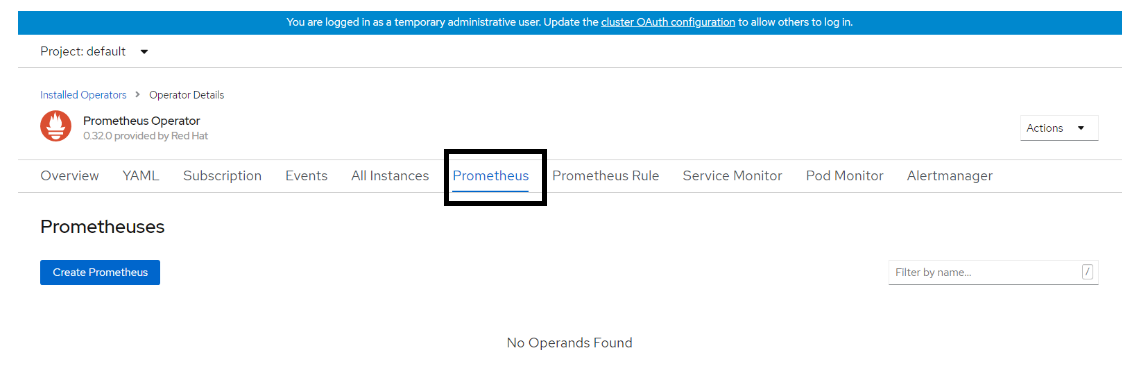
Figure 112. Prometheus service
After clicking Create Prometheus, YAML file will be displayed. Click Create. Below snapshot shows the output for Prometheus service YAML.
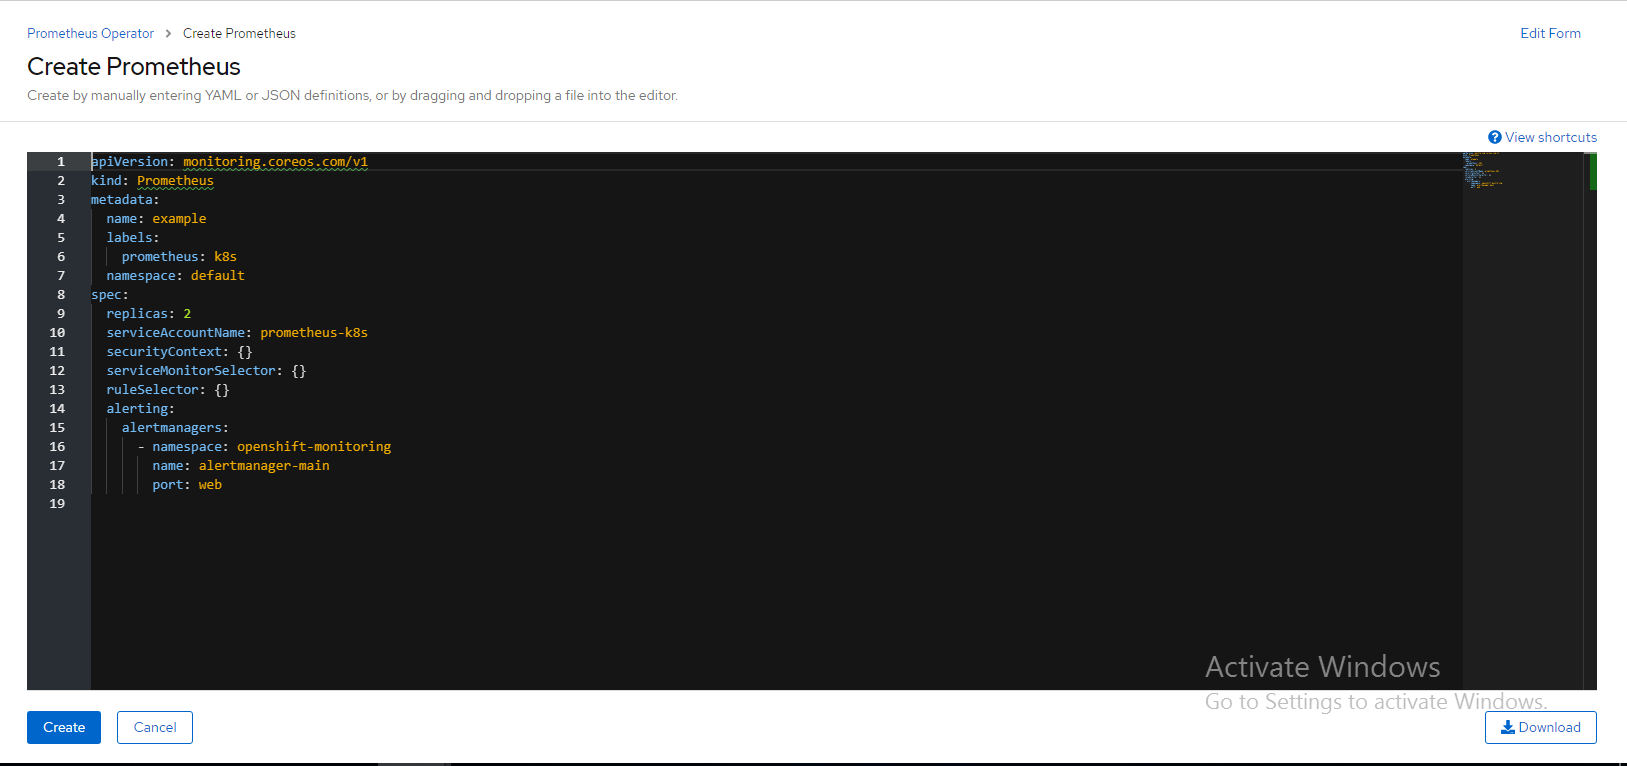
Figure 113.. Prometheus service YAML
On the Prometheus Operator page, scroll right and go to Service Monitor. Click Create Service Monitor. Below snapshot shows the output of Create Service Monitor.
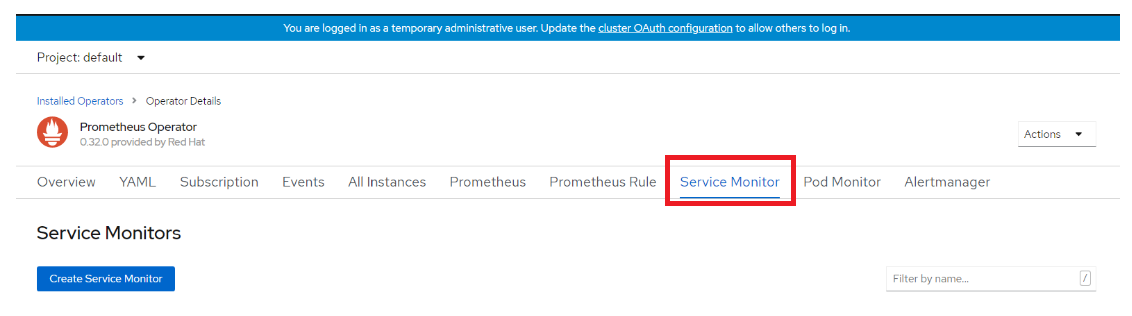
Figure 114. Create Service Monitor
After clicking Create Service Monitor, YAML file will be displayed and then change the required values in matchLabels section as app: log-generator , port: http, and interval: 10s.
Below snapshot shows the output for Create Service Monitor YAML.
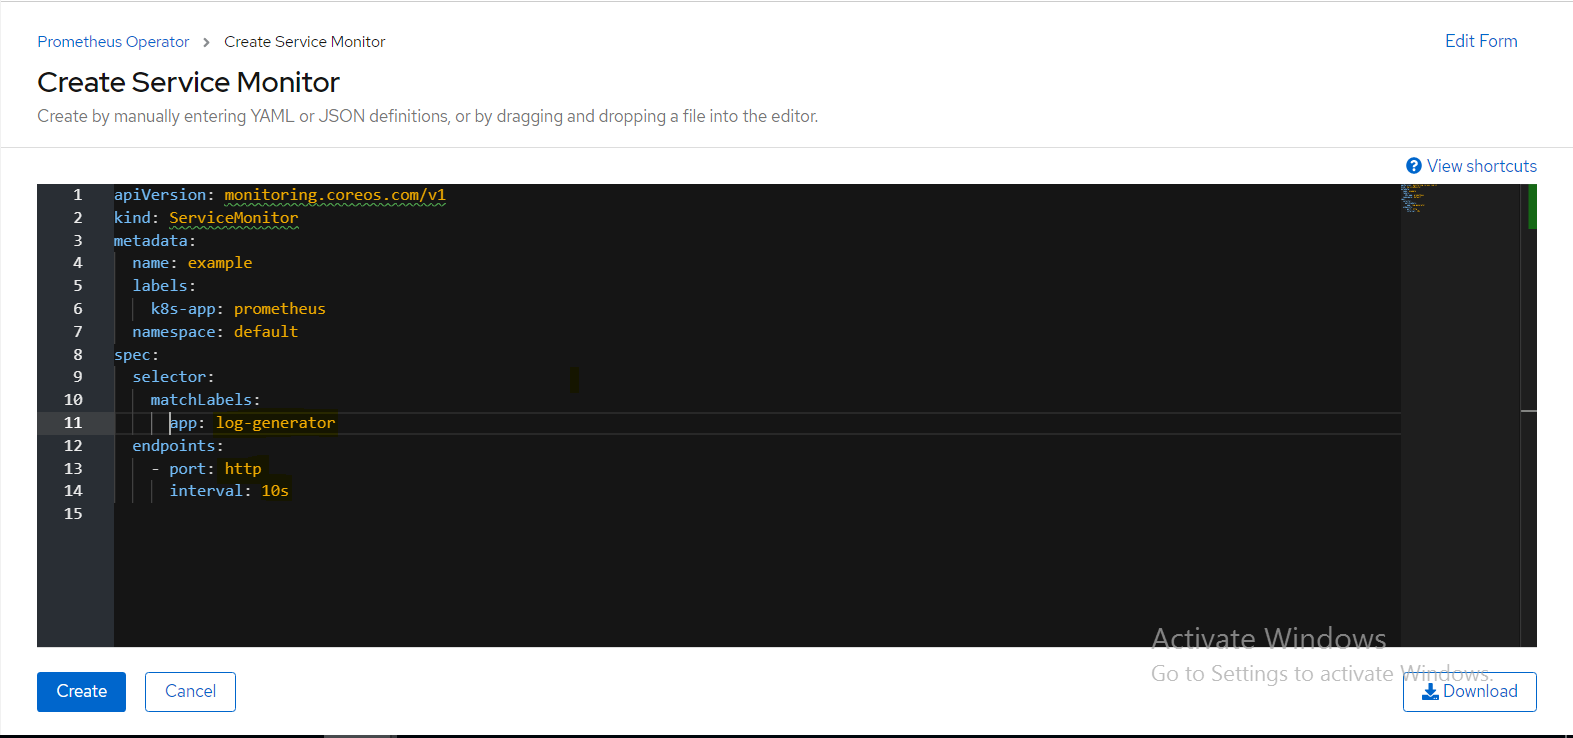
Figure 115.. Service Monitor YAML
On the console page, navigate to Networking option. Click Routes option to open the Create Route page for Prometheus. Enter details for Name and Services. Select the Prometheus operator. Select the Target Port as 9090. Click Create to generate the Prometheus URL.
Below snapshot shows the output for Create Prometheus operator URL.
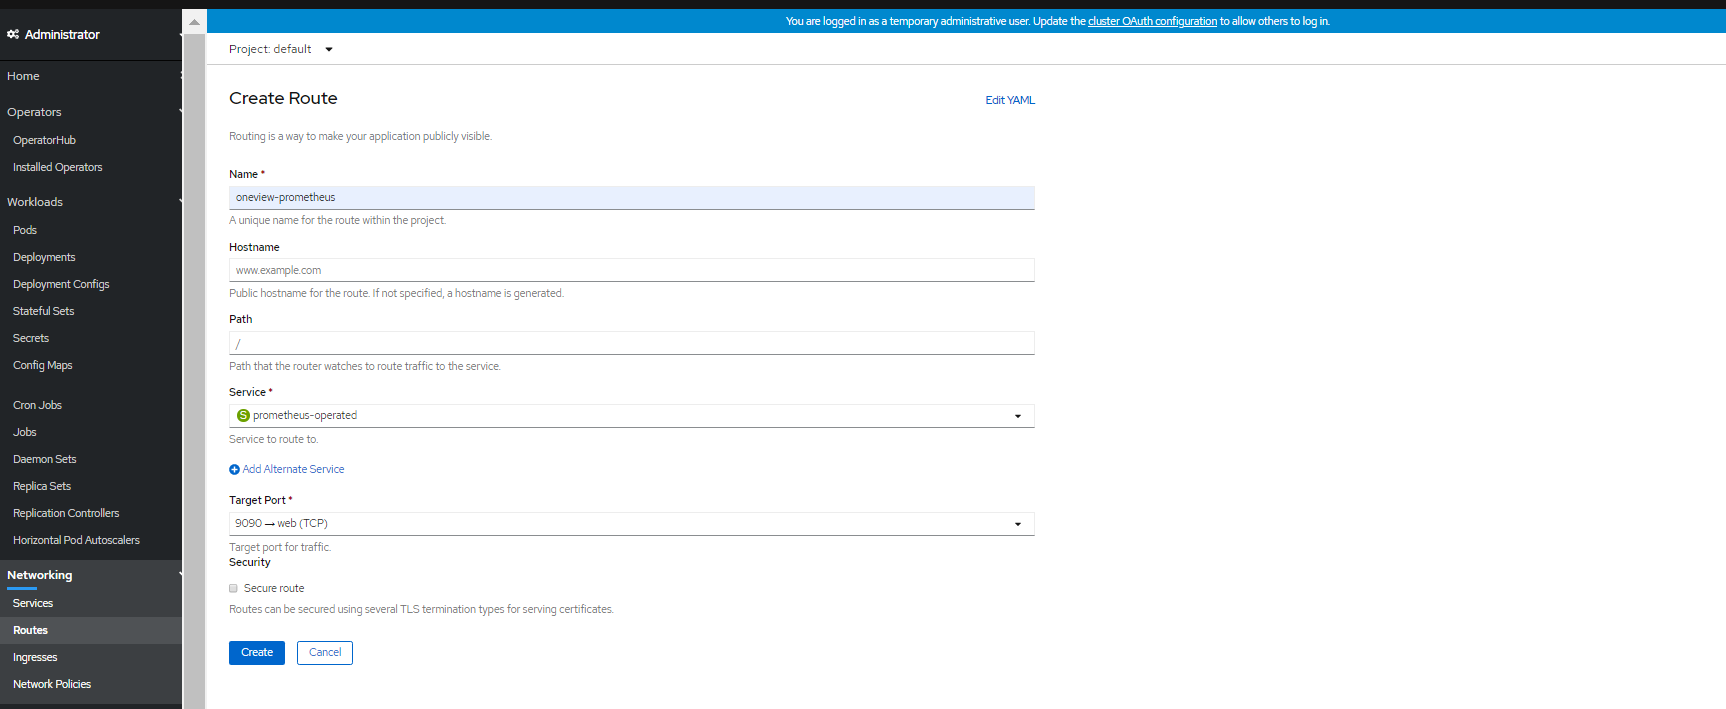
Figure 116. Create Prometheus operator URLOn the Routes page, navigate to Location. Click Prometheus URL to open Prometheus dashboard.
Below snapshot shows the output for Click Prometheus URL to open Prometheus dashboard .
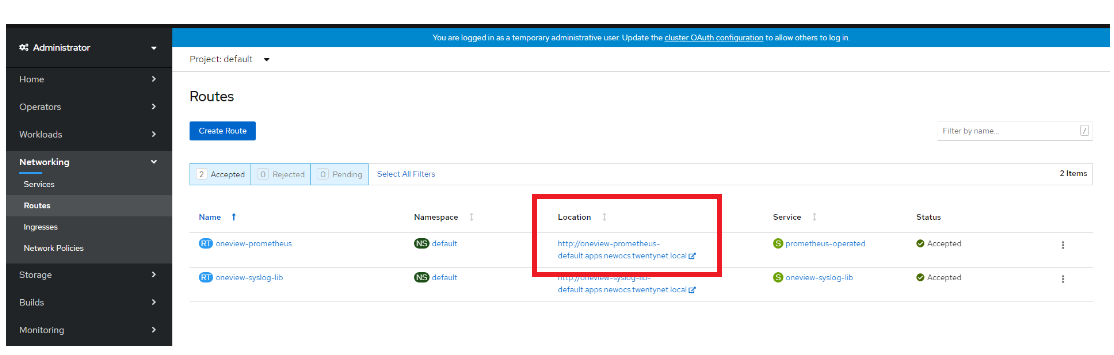 Figure 117. Link for Prometheus operator URL dashboard
Below snapshot shows the output of window Prometheus operator dashboard .
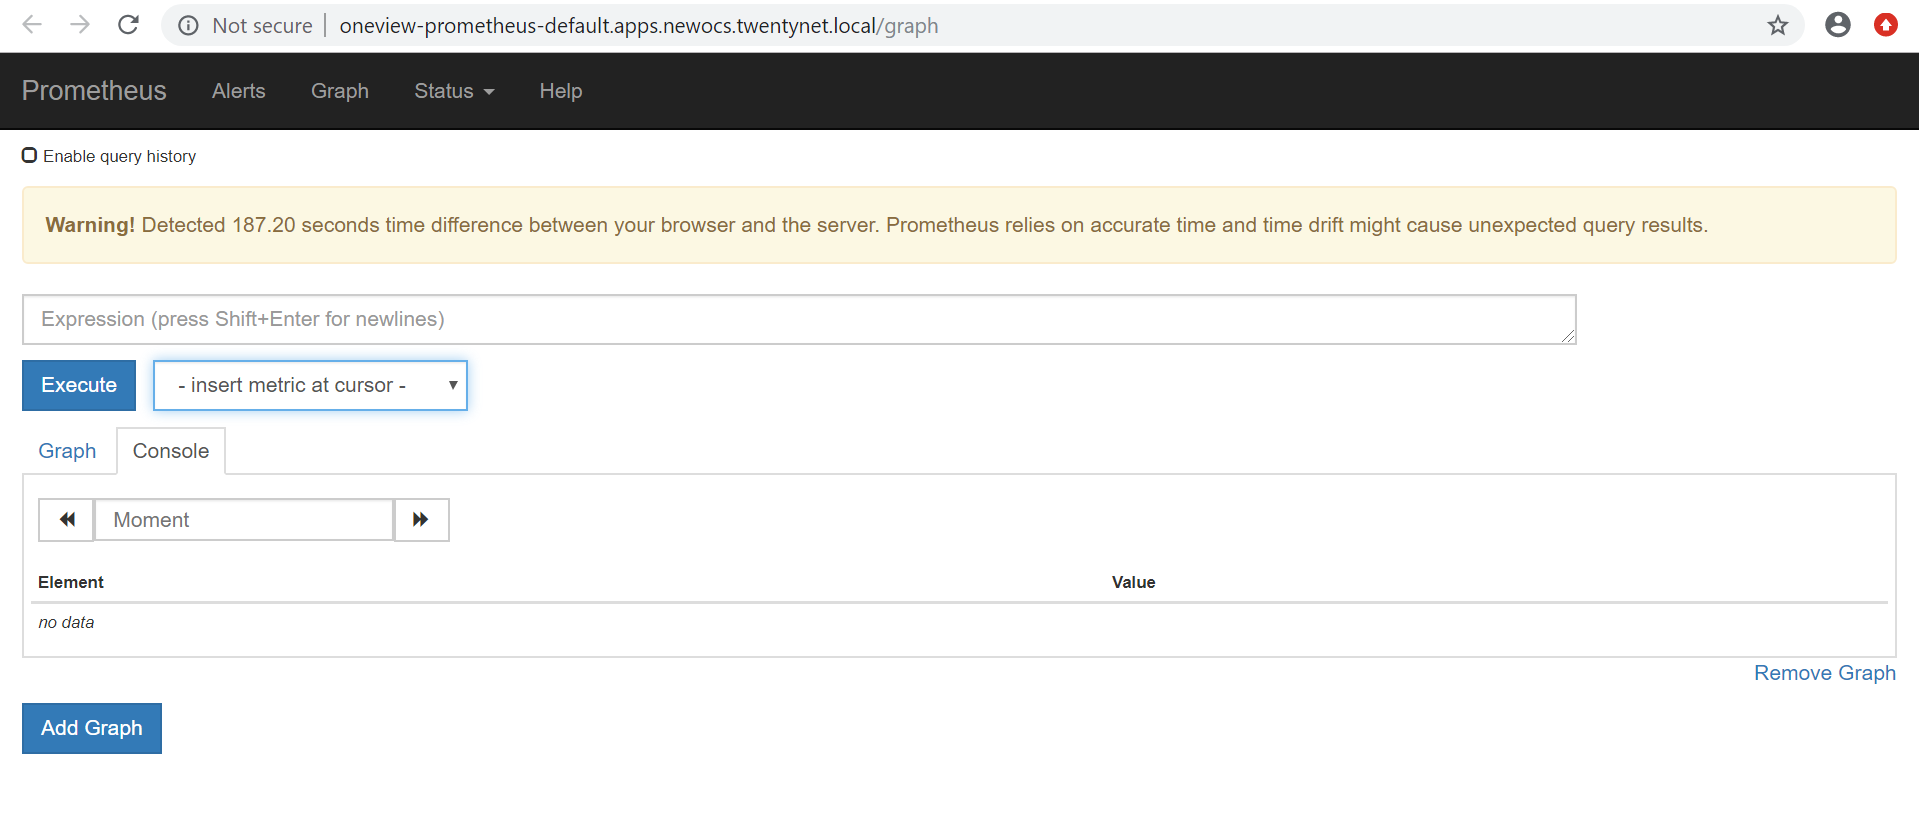 Figure 118 Prometheus operator dashboard status
WARNING
Time difference between the browser and the server is expressed in seconds. Prometheus relies on accurate time and time drift might cause unexpected query results.
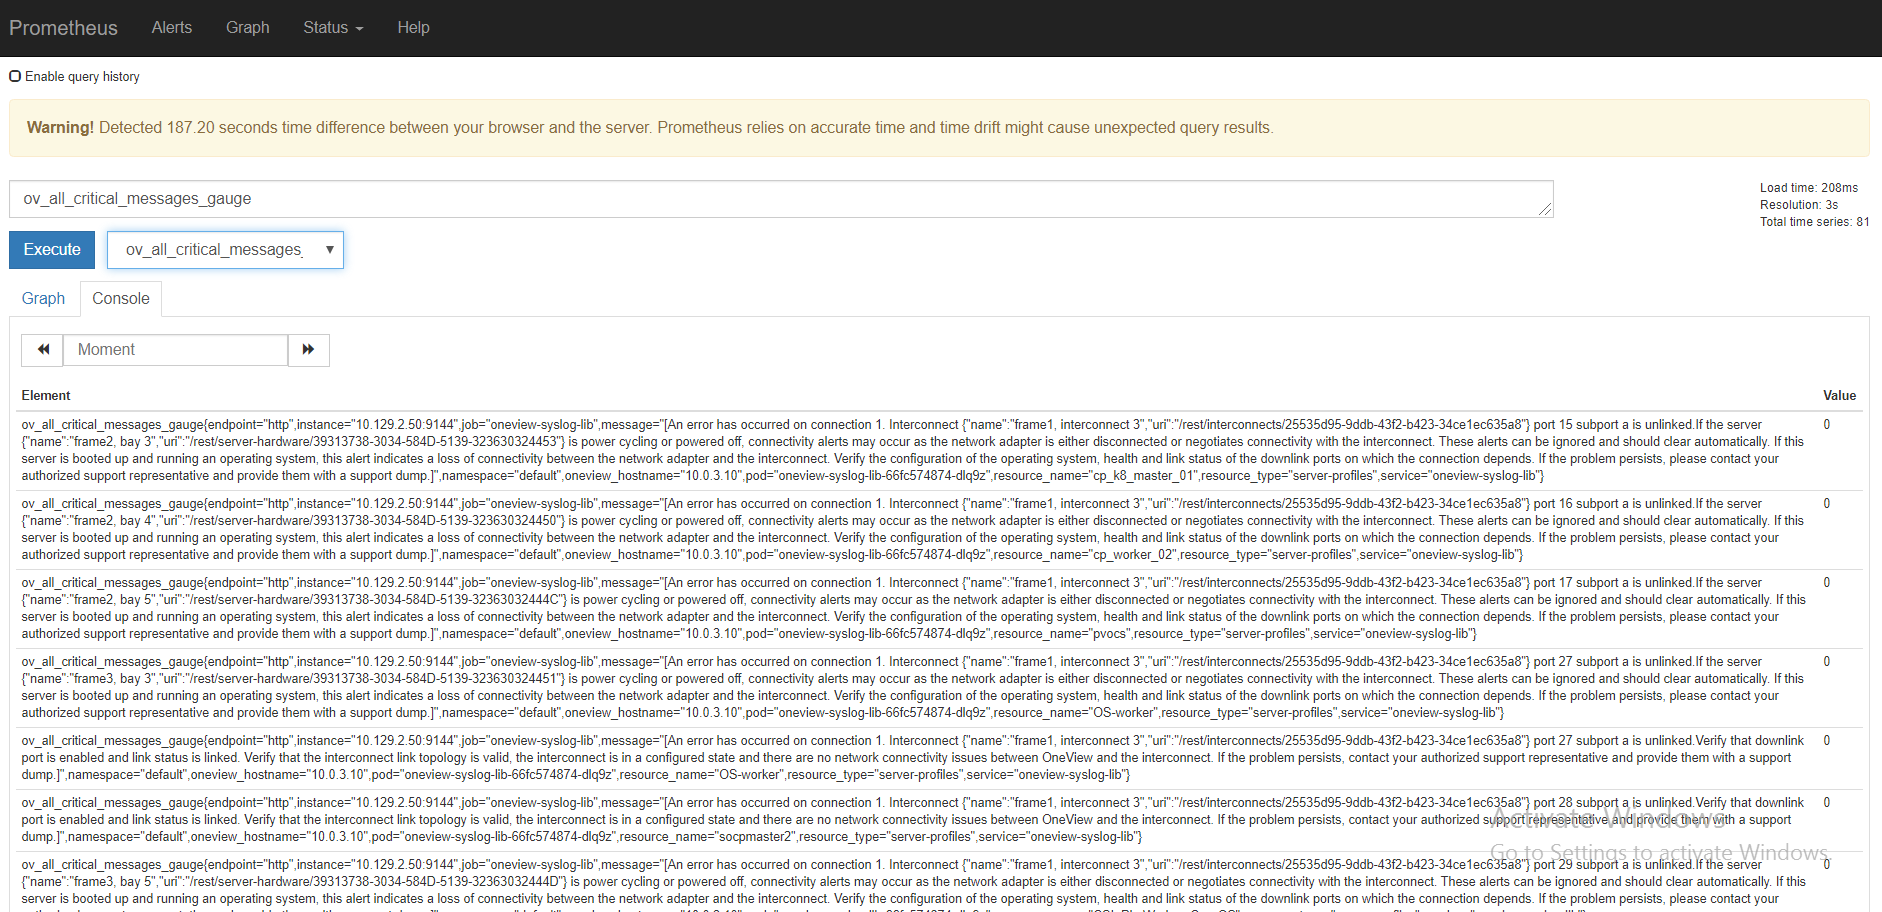
On the Prometheus dashboard, select ov_all_critical_messages from the drop-down list and click Execute. Below figure shows the output of checking HP OV(OneView) events in Prometheus operator dashboard. Below snapshot HPE OneView events in Prometheus operator dashboard
Click the Graph option to see the graphical view. Below figure shows the output of HPE OneView events in graphical view on Prometheus operator dashboard.
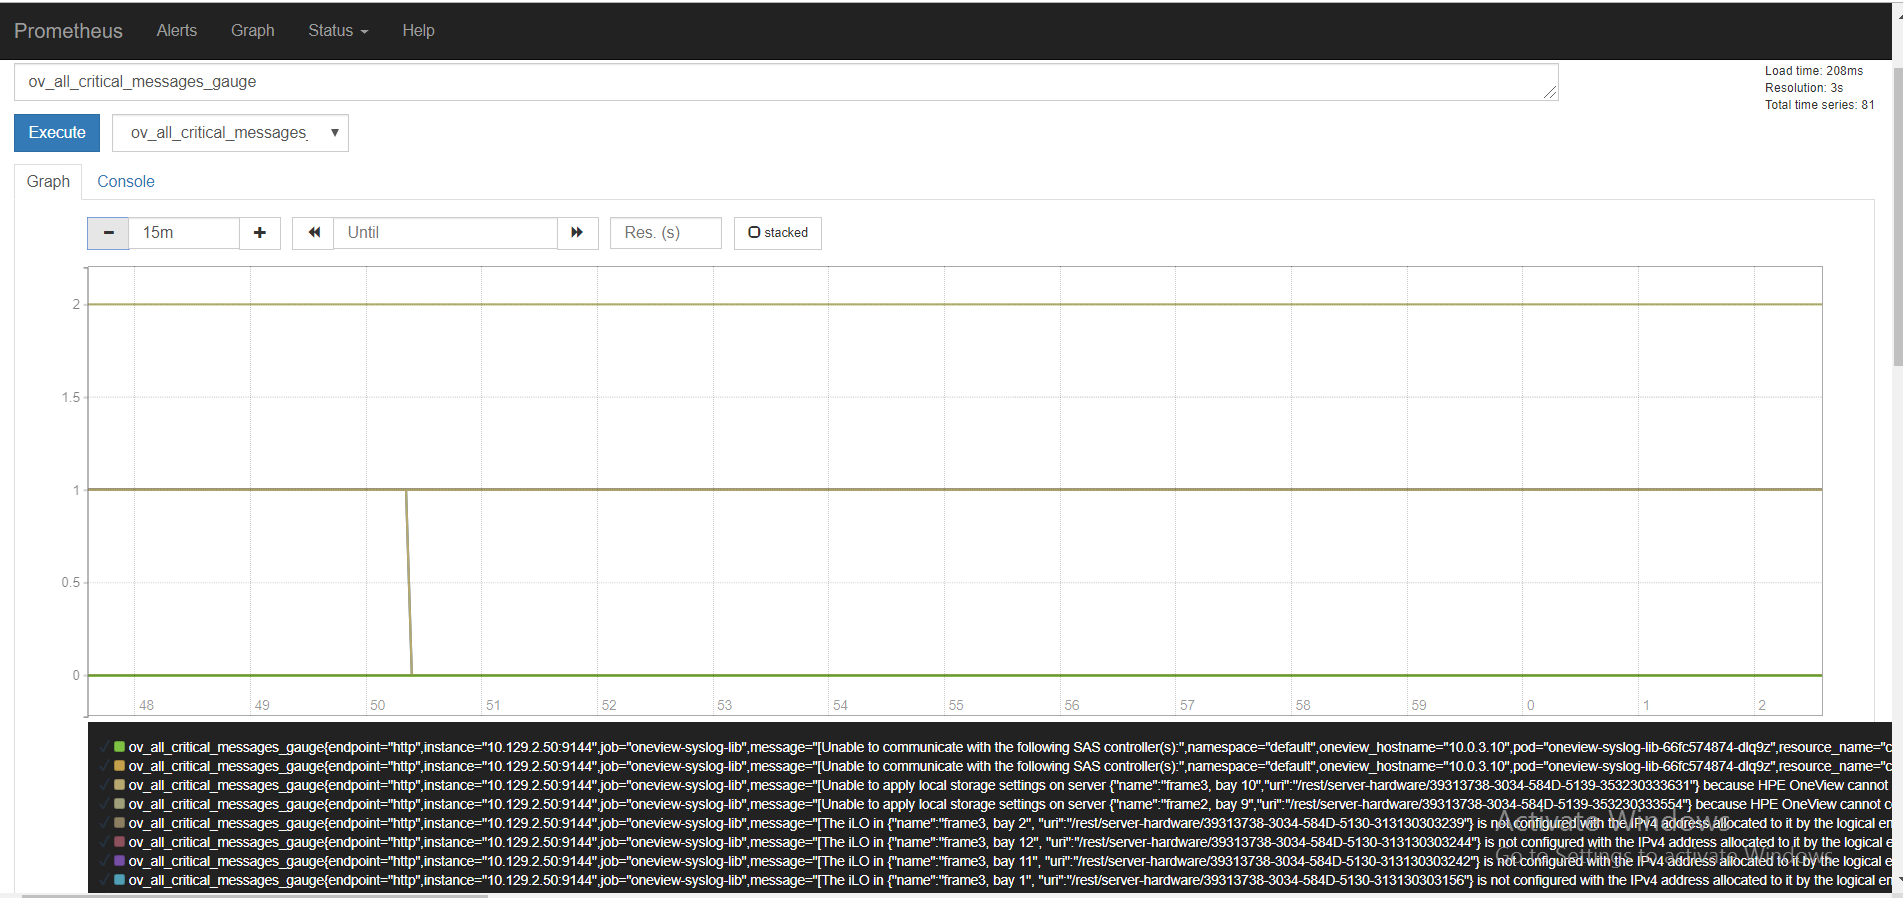
Figure 120. HPE OneView events in graphical view on Prometheus operator dashboard